How to create, review, and troubleshoot reports in Sanka.
Last updated: June 4, 2026
Reports help you analyze Sanka records by choosing an object, metric, filter, breakdown, and chart type. This guide explains what reports control, how to create and update them, and what to check when report numbers look empty or different from another screen.
What reports control
A report is a saved analysis of records in one object. It does not store separate business data. Instead, it reads the records that match the selected settings and displays the result as a chart, table, number, or sheet.Common report settings include:
Name: the label users see in the report list and dashboards
Report type: the visual format, such as line chart, bar chart, table, pivot table, number, funnel, or forecast
Object: the record type to analyze, such as order, invoice, payment, item, company, or contact
Metric: the count, sum, amount, or other value the report calculates
Filter: the conditions that decide which records are included
Breakdown: the category used to split the result, such as owner, status, item category, or month
Date or X-axis: the period or field used to group results over time
If a field, metric, chart type, or breakdown is not available, check the selected object, custom properties, module access, and your permissions before treating it as a bug.
Expected behavior
When a report is configured correctly:
It appears in the report list unless it is archived, deleted, or filtered out of the current view.
The result changes when source records are created, updated, imported, archived, or synced from integrations.
Users only see reports and underlying records that their role and workspace access allow.
A dashboard that contains the report shows the same report result, subject to dashboard and home widget settings.
Archiving a report hides it from active lists, while deleting a report removes it and cannot be restored from the normal report screen.
Reports do not automatically fix missing data, create records, or change object properties. If the report output is wrong, first confirm the source records, filters, date field, metric, and permissions.
Review a report with AI
When asking AI to help with reports, start with a review step. This keeps the AI from changing filters, deleting reports, or explaining a wrong number before it checks the source data.
Sample prompt
/sanka Review this Sanka report before making changes. Show the selected object, metric, filters, date field, breakdown, chart type, dashboard usage, permissions to consider, and source records that explain the current result. Do not update, archive, or delete the report yet.
After the review, confirm whether the report should be updated, duplicated, archived, or left unchanged. If the question is about a customer-facing number, compare the report against the related object list or export before replying.
Create a report
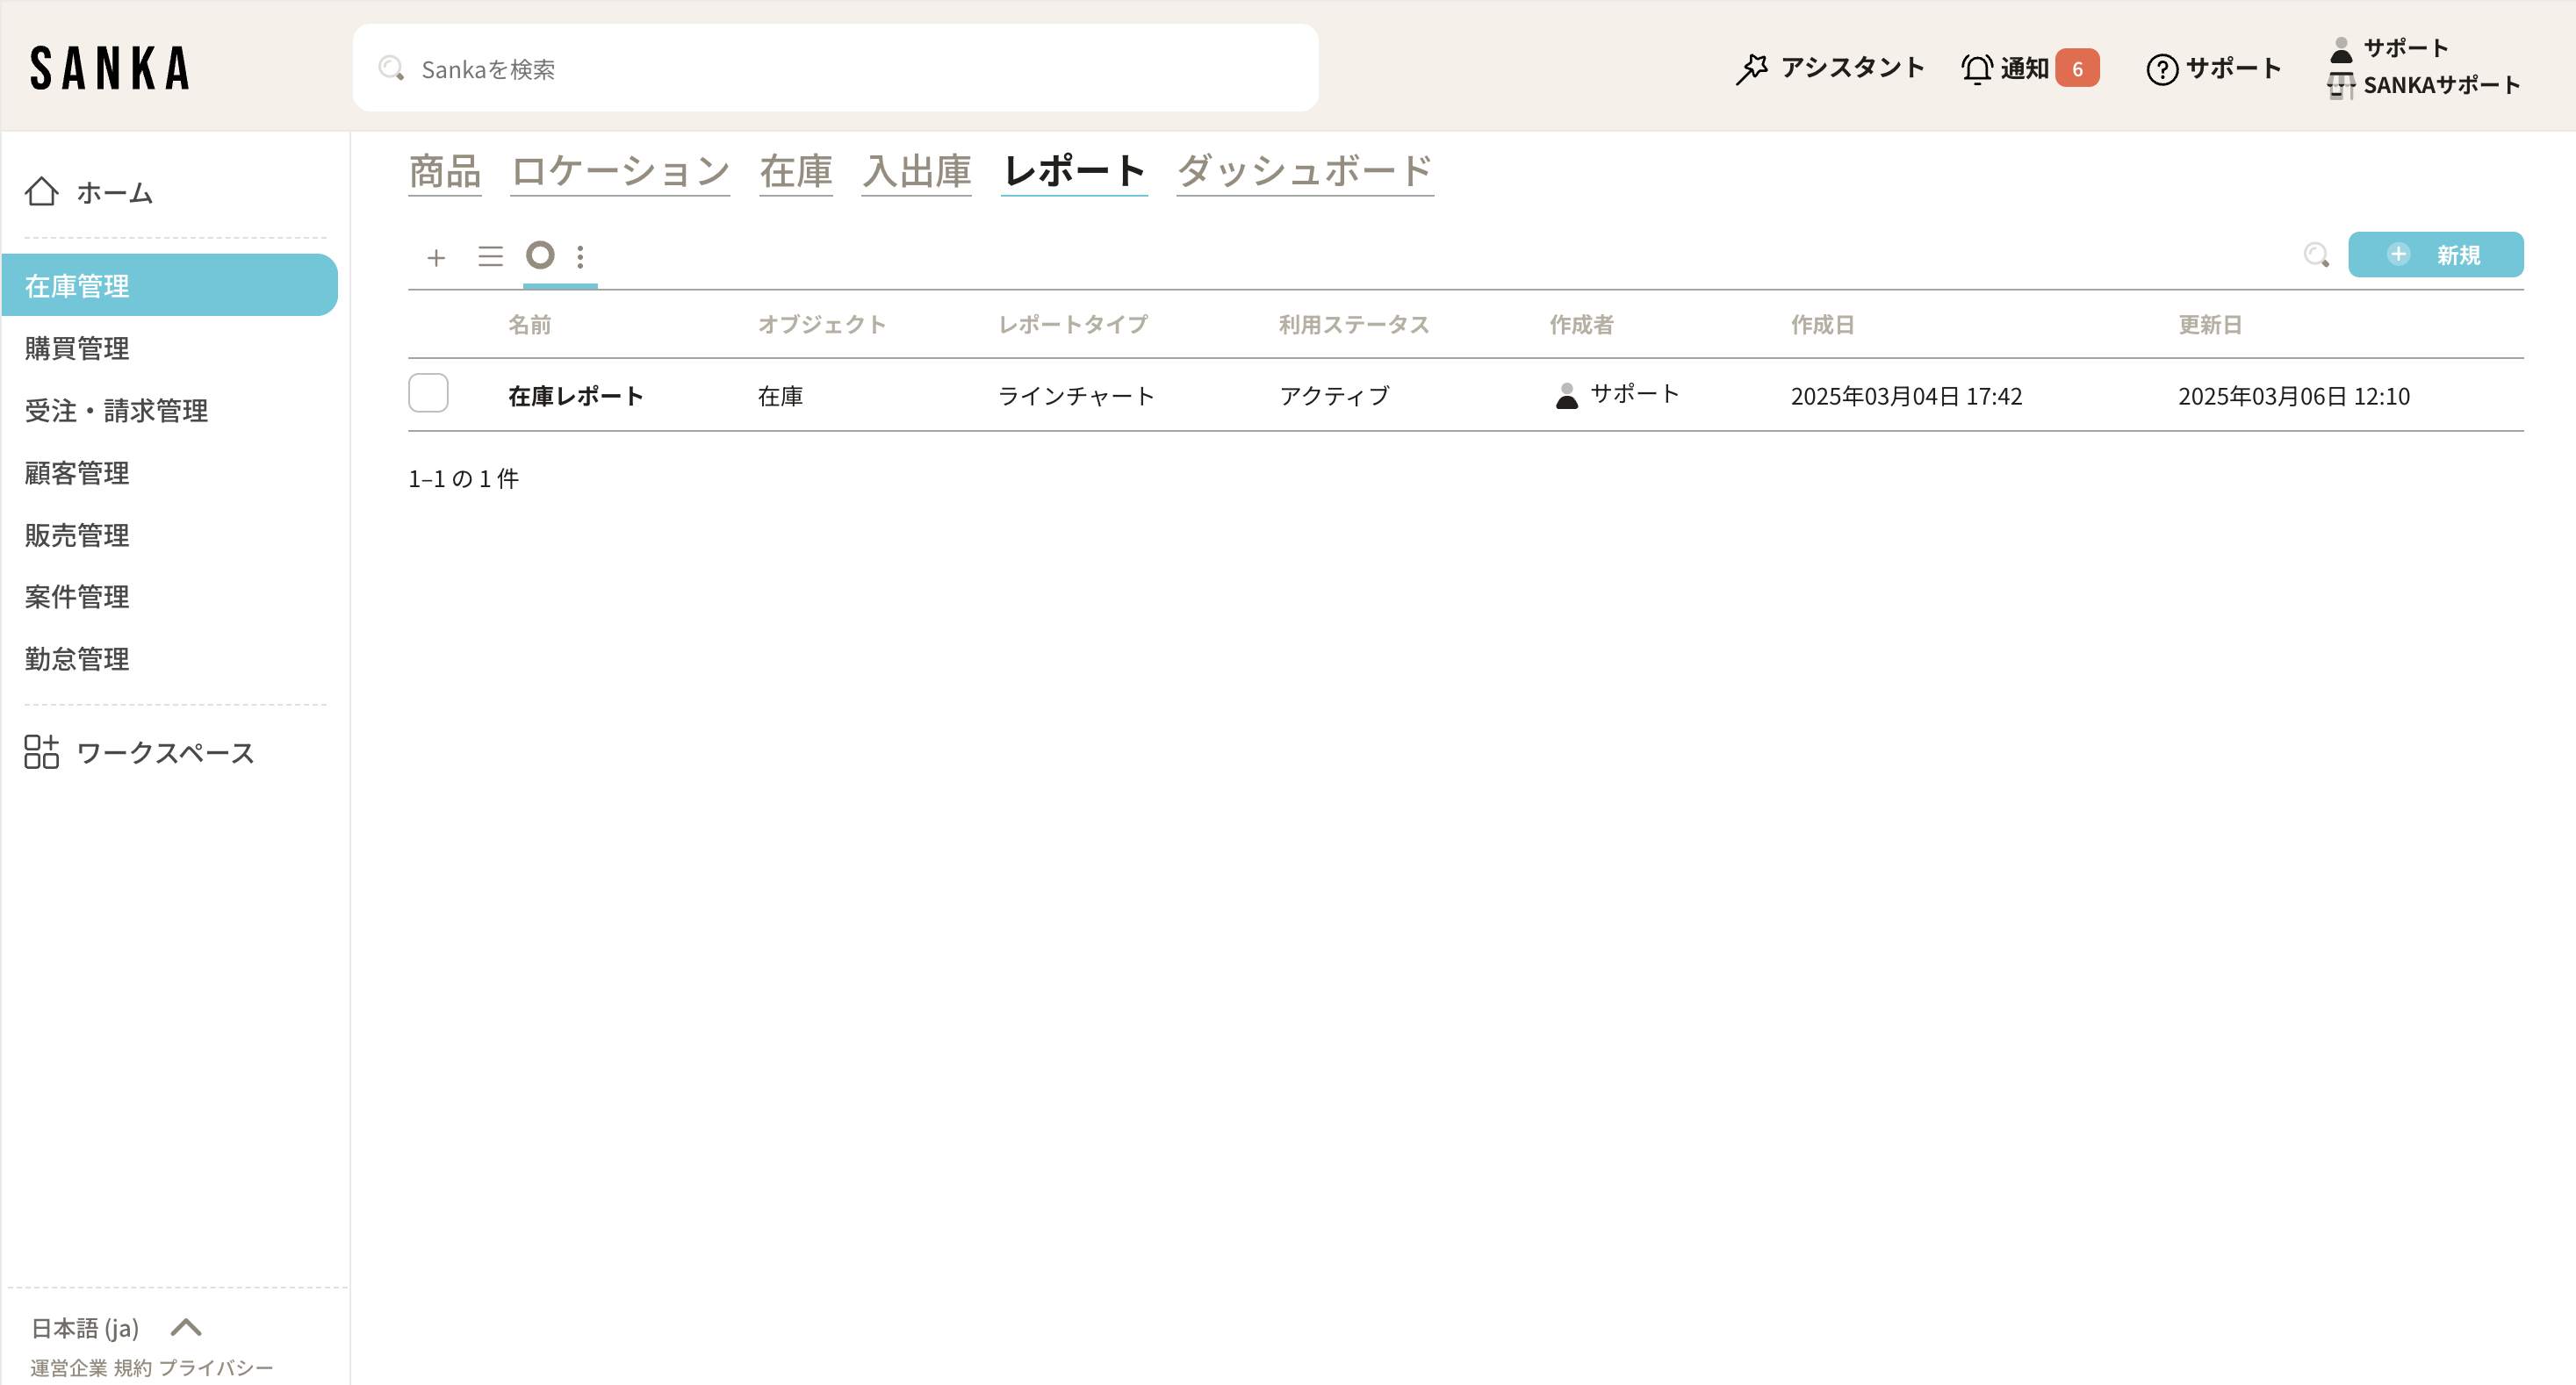
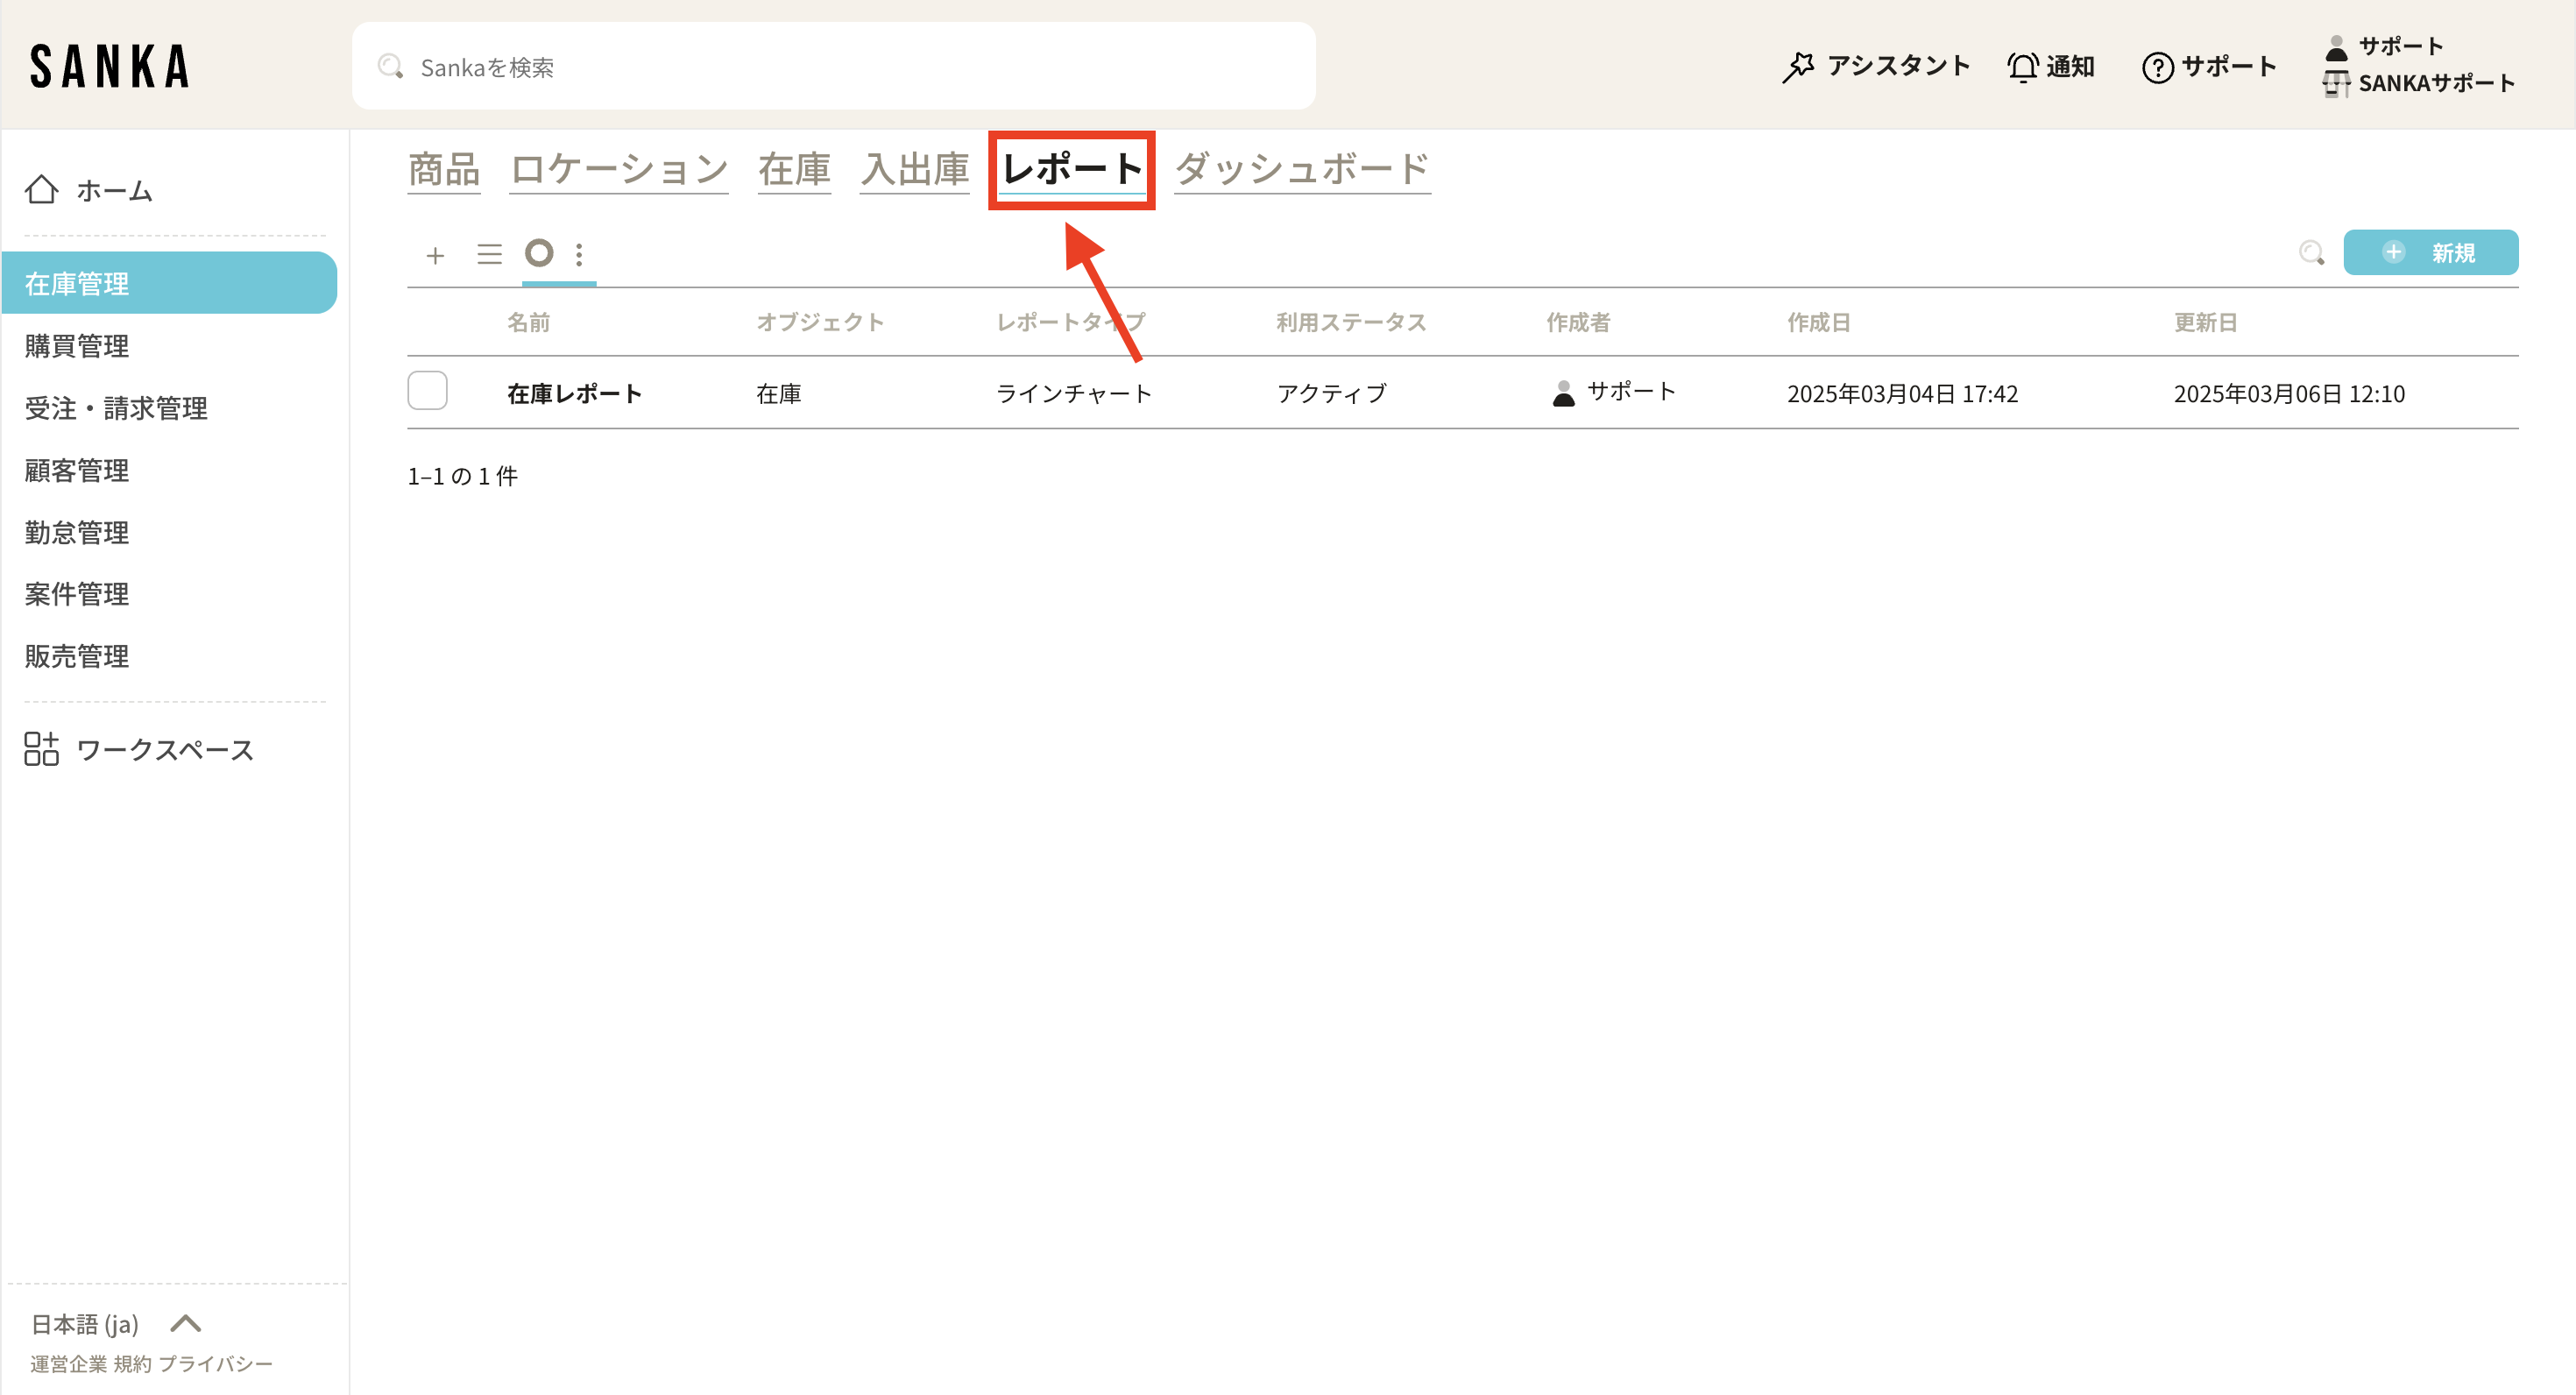
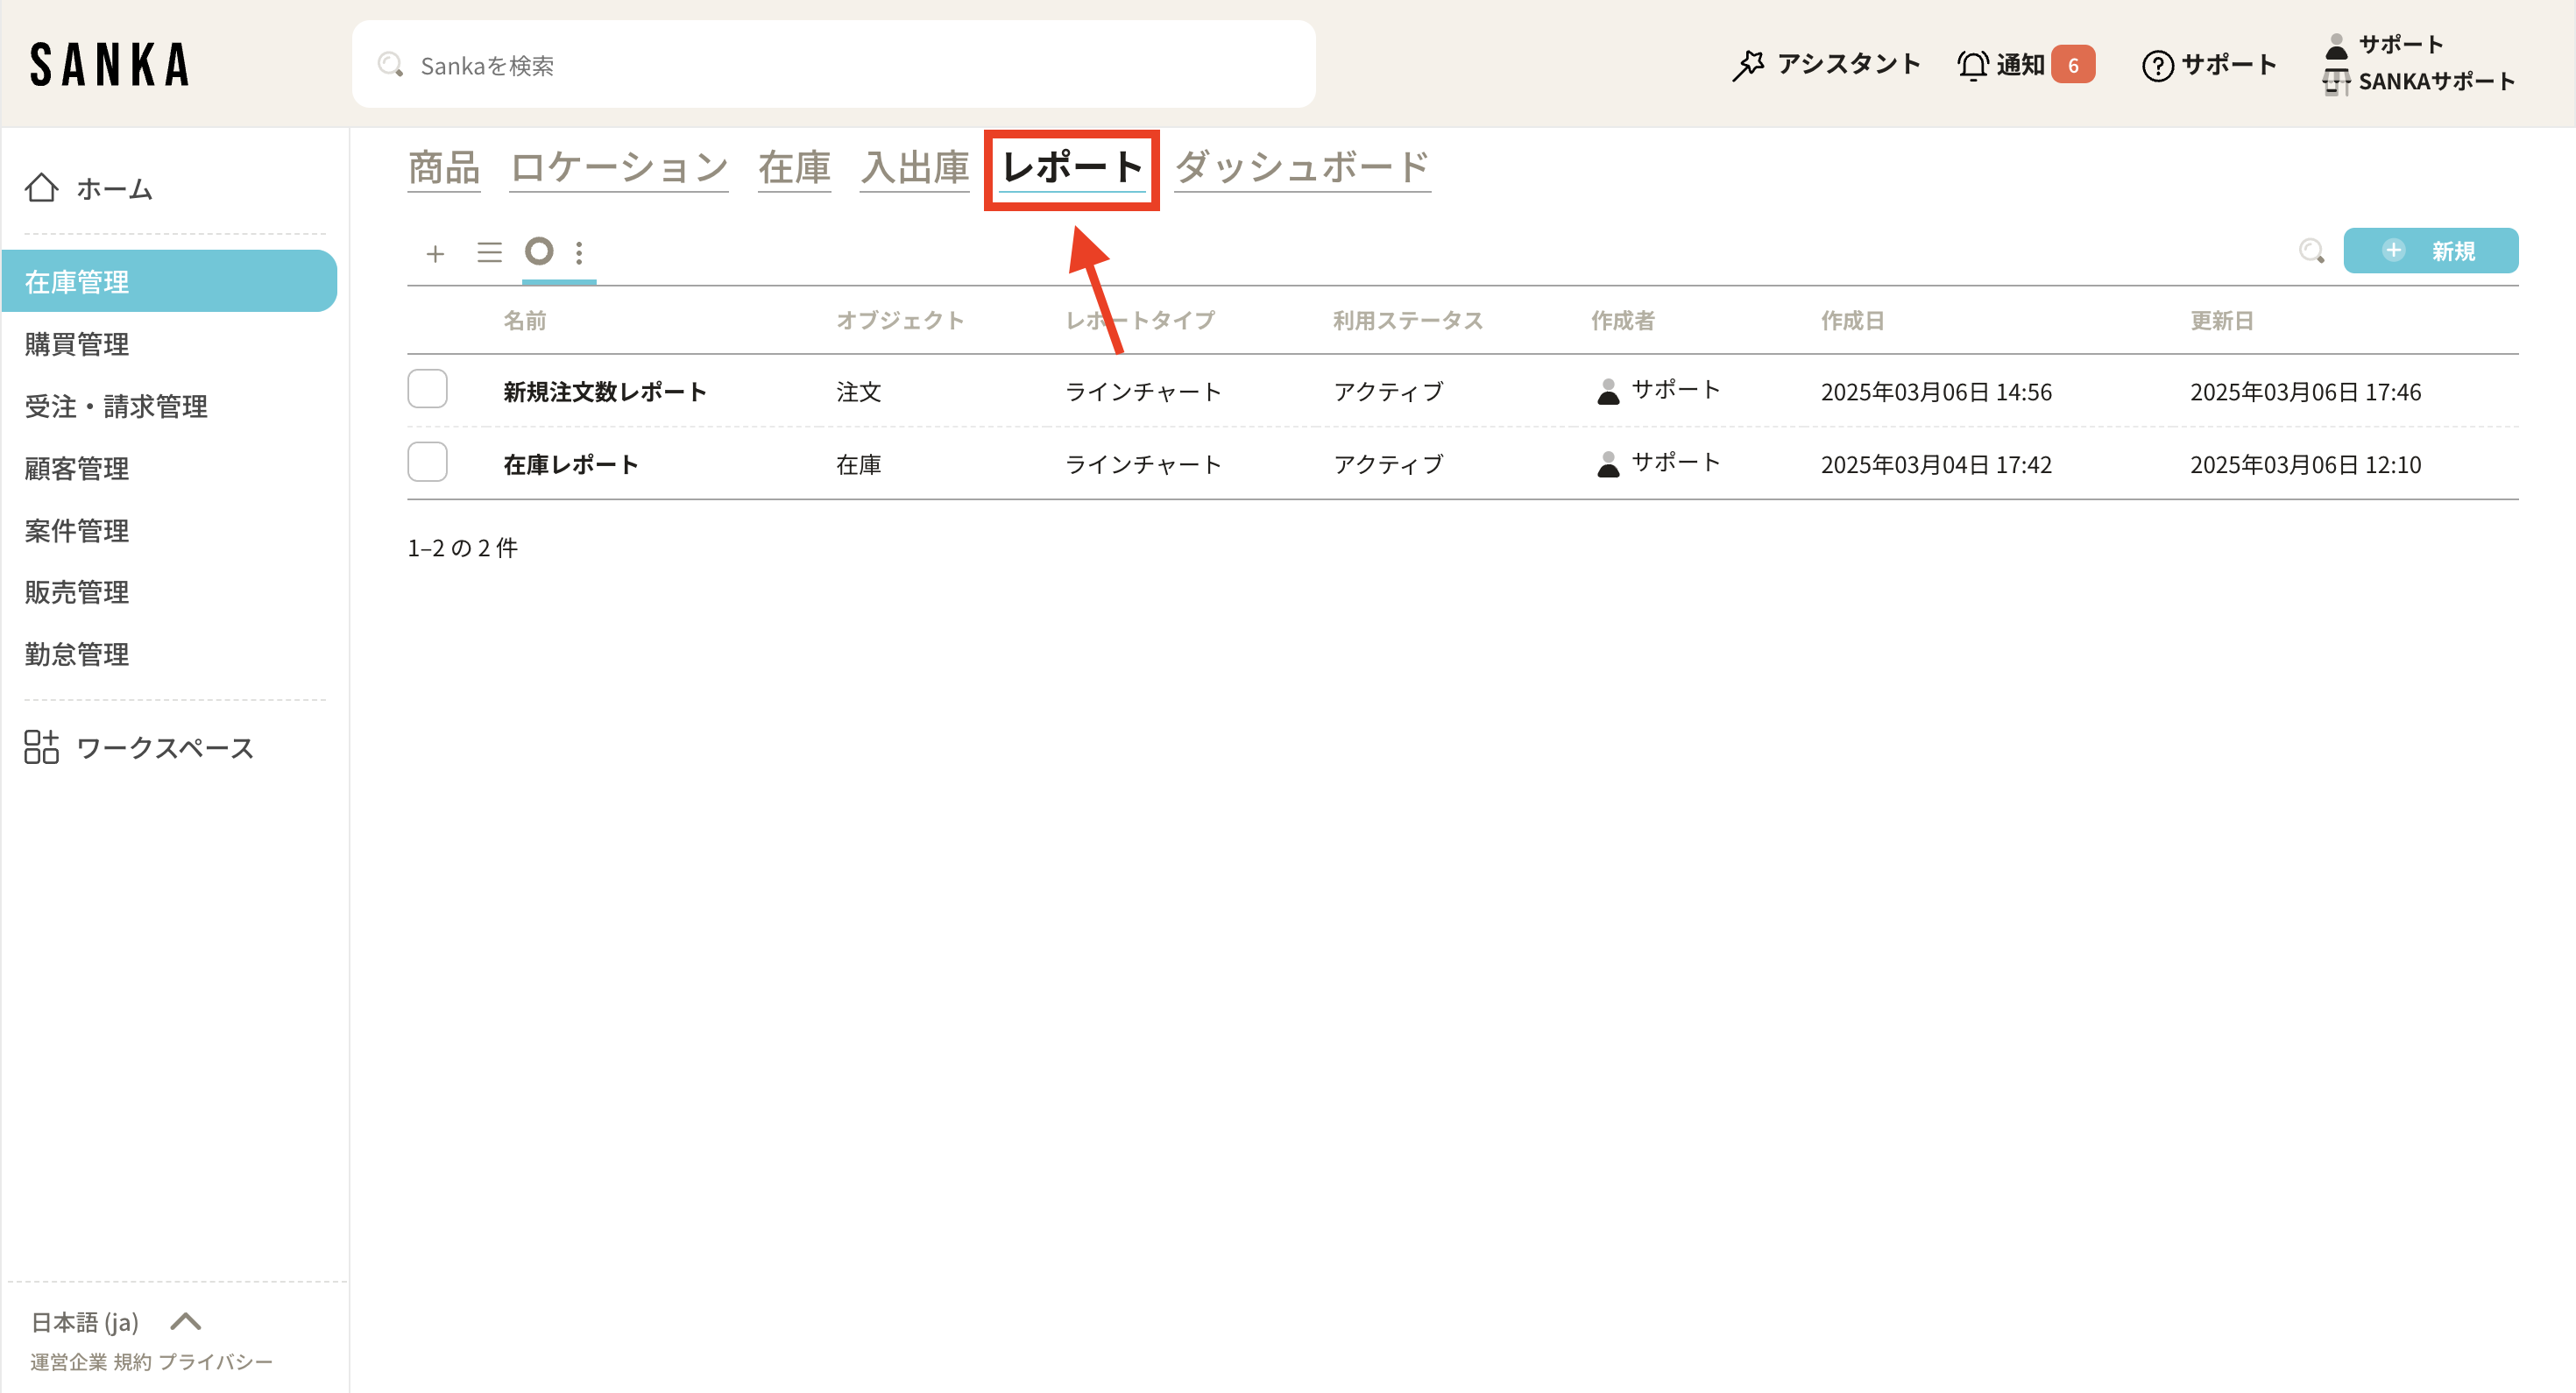
Open Reports from the left menu. Reports may appear inside modules such as inventory, SCM, procurement, purchasing, finance, or sales depending on your workspace.
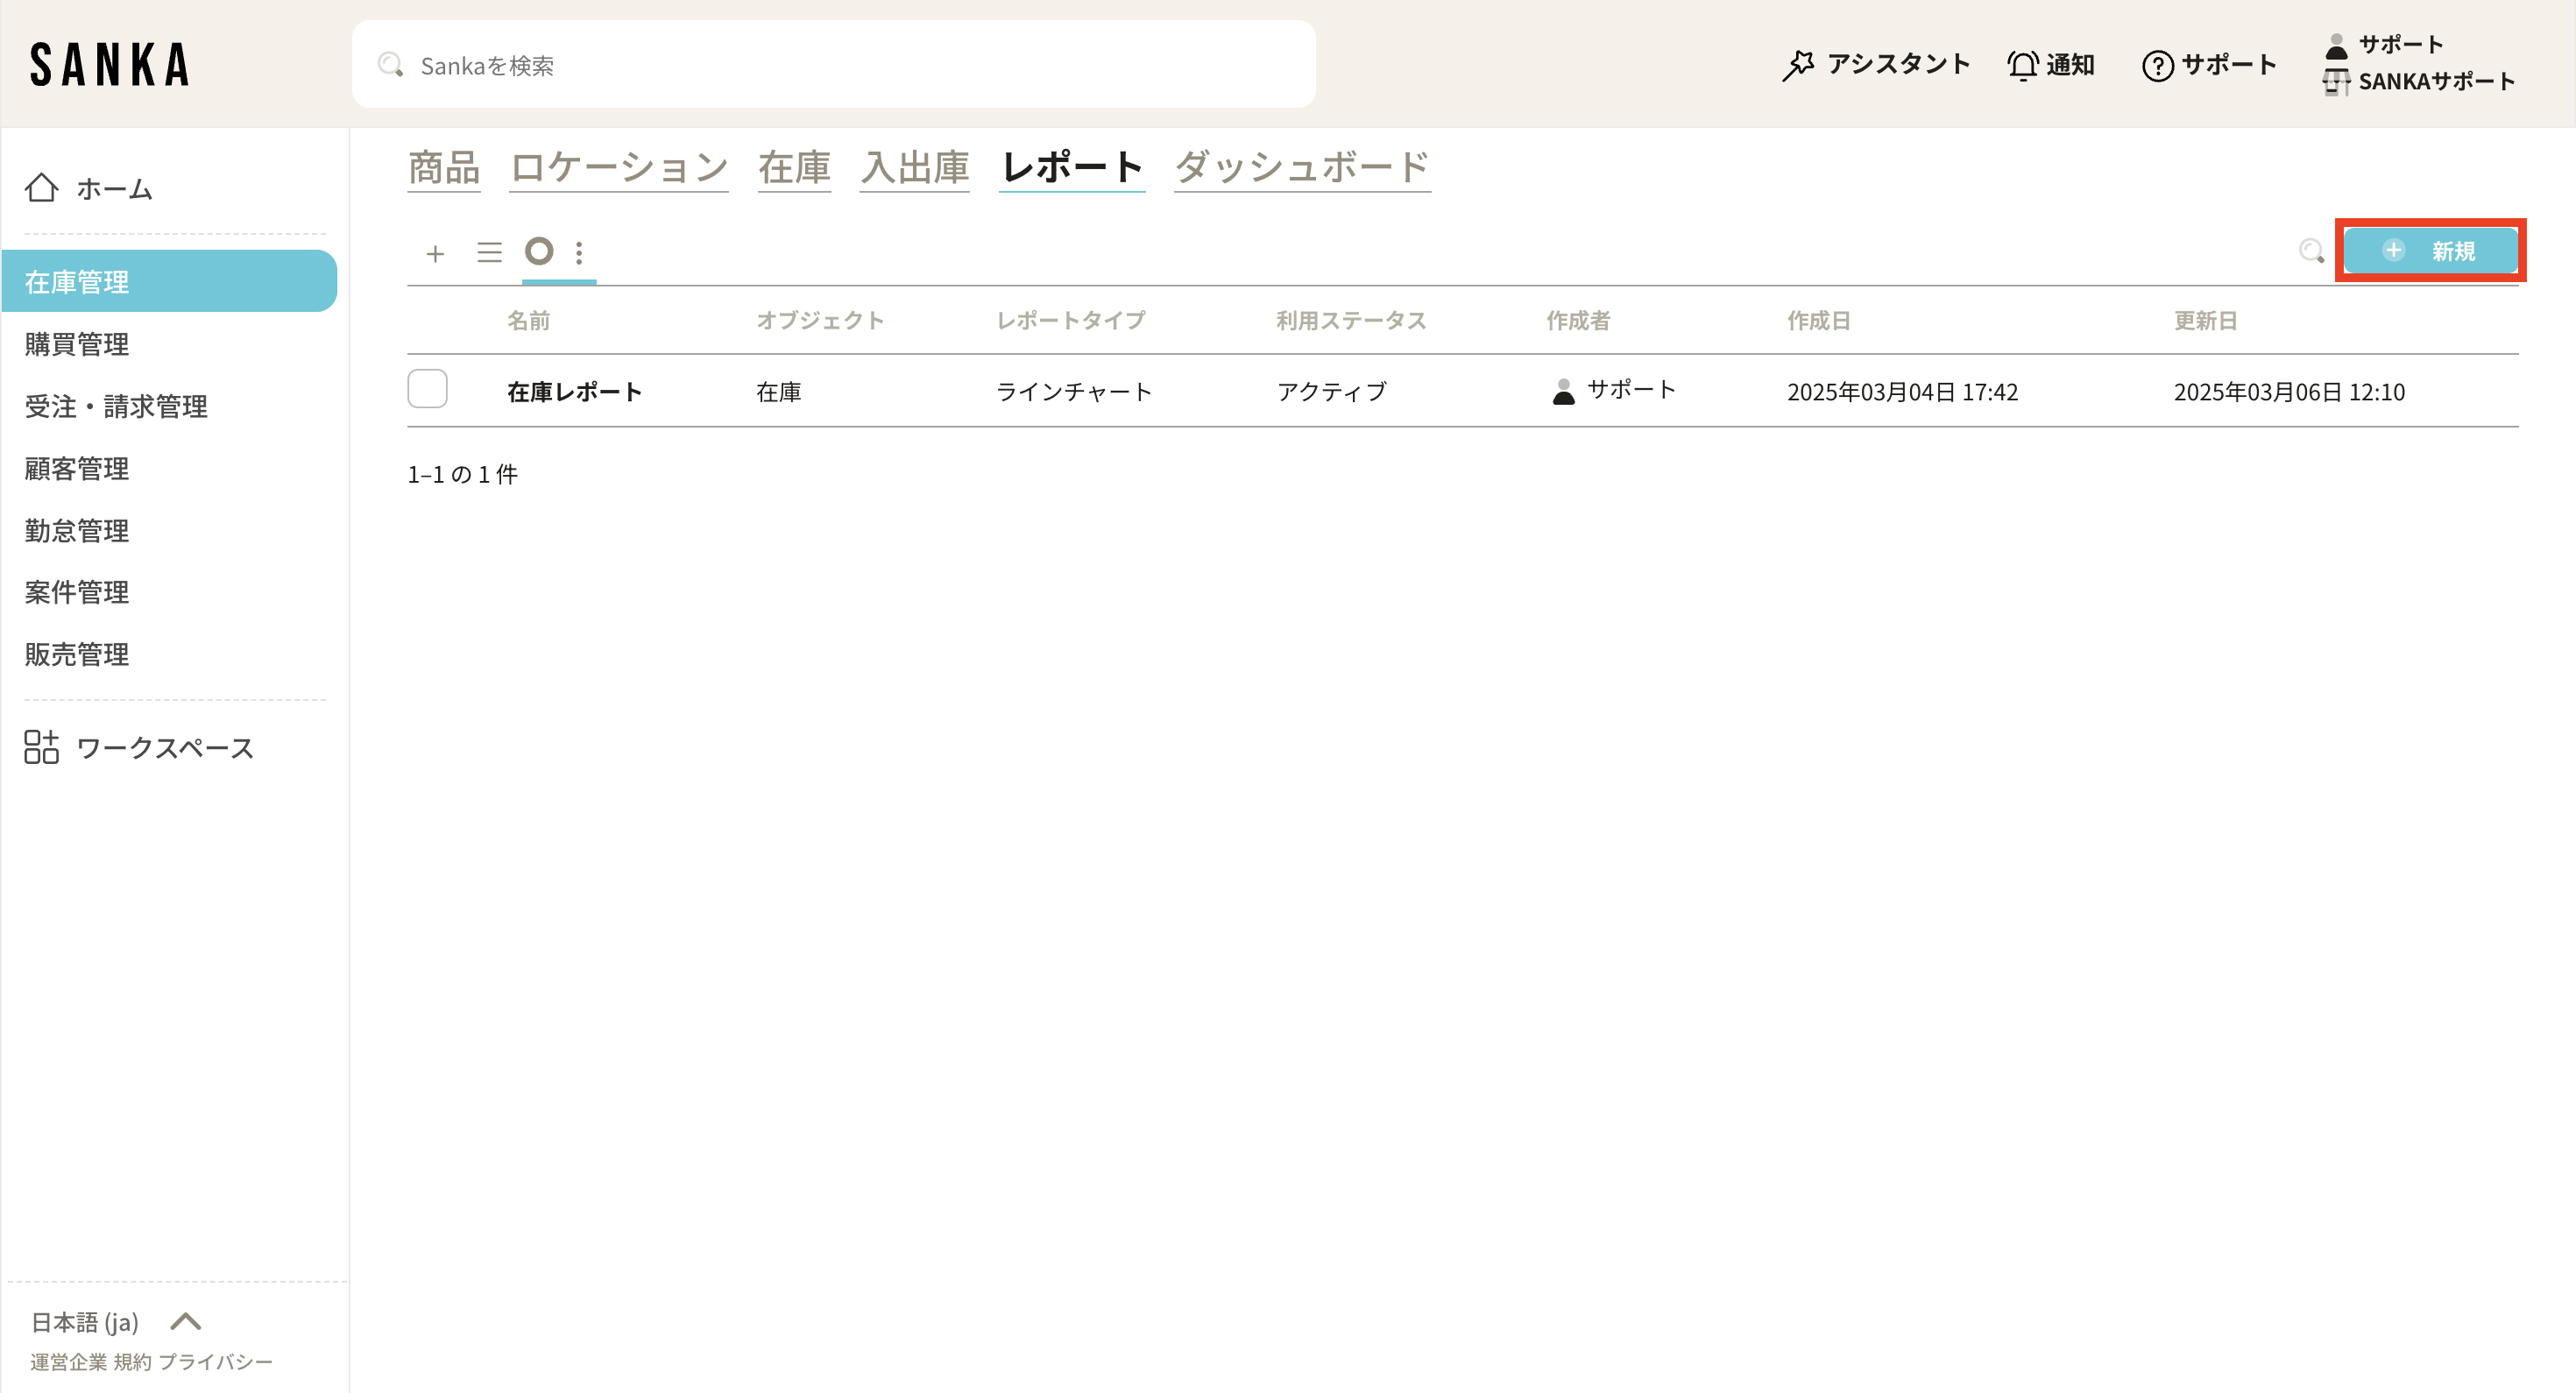
Click New in the top right corner.
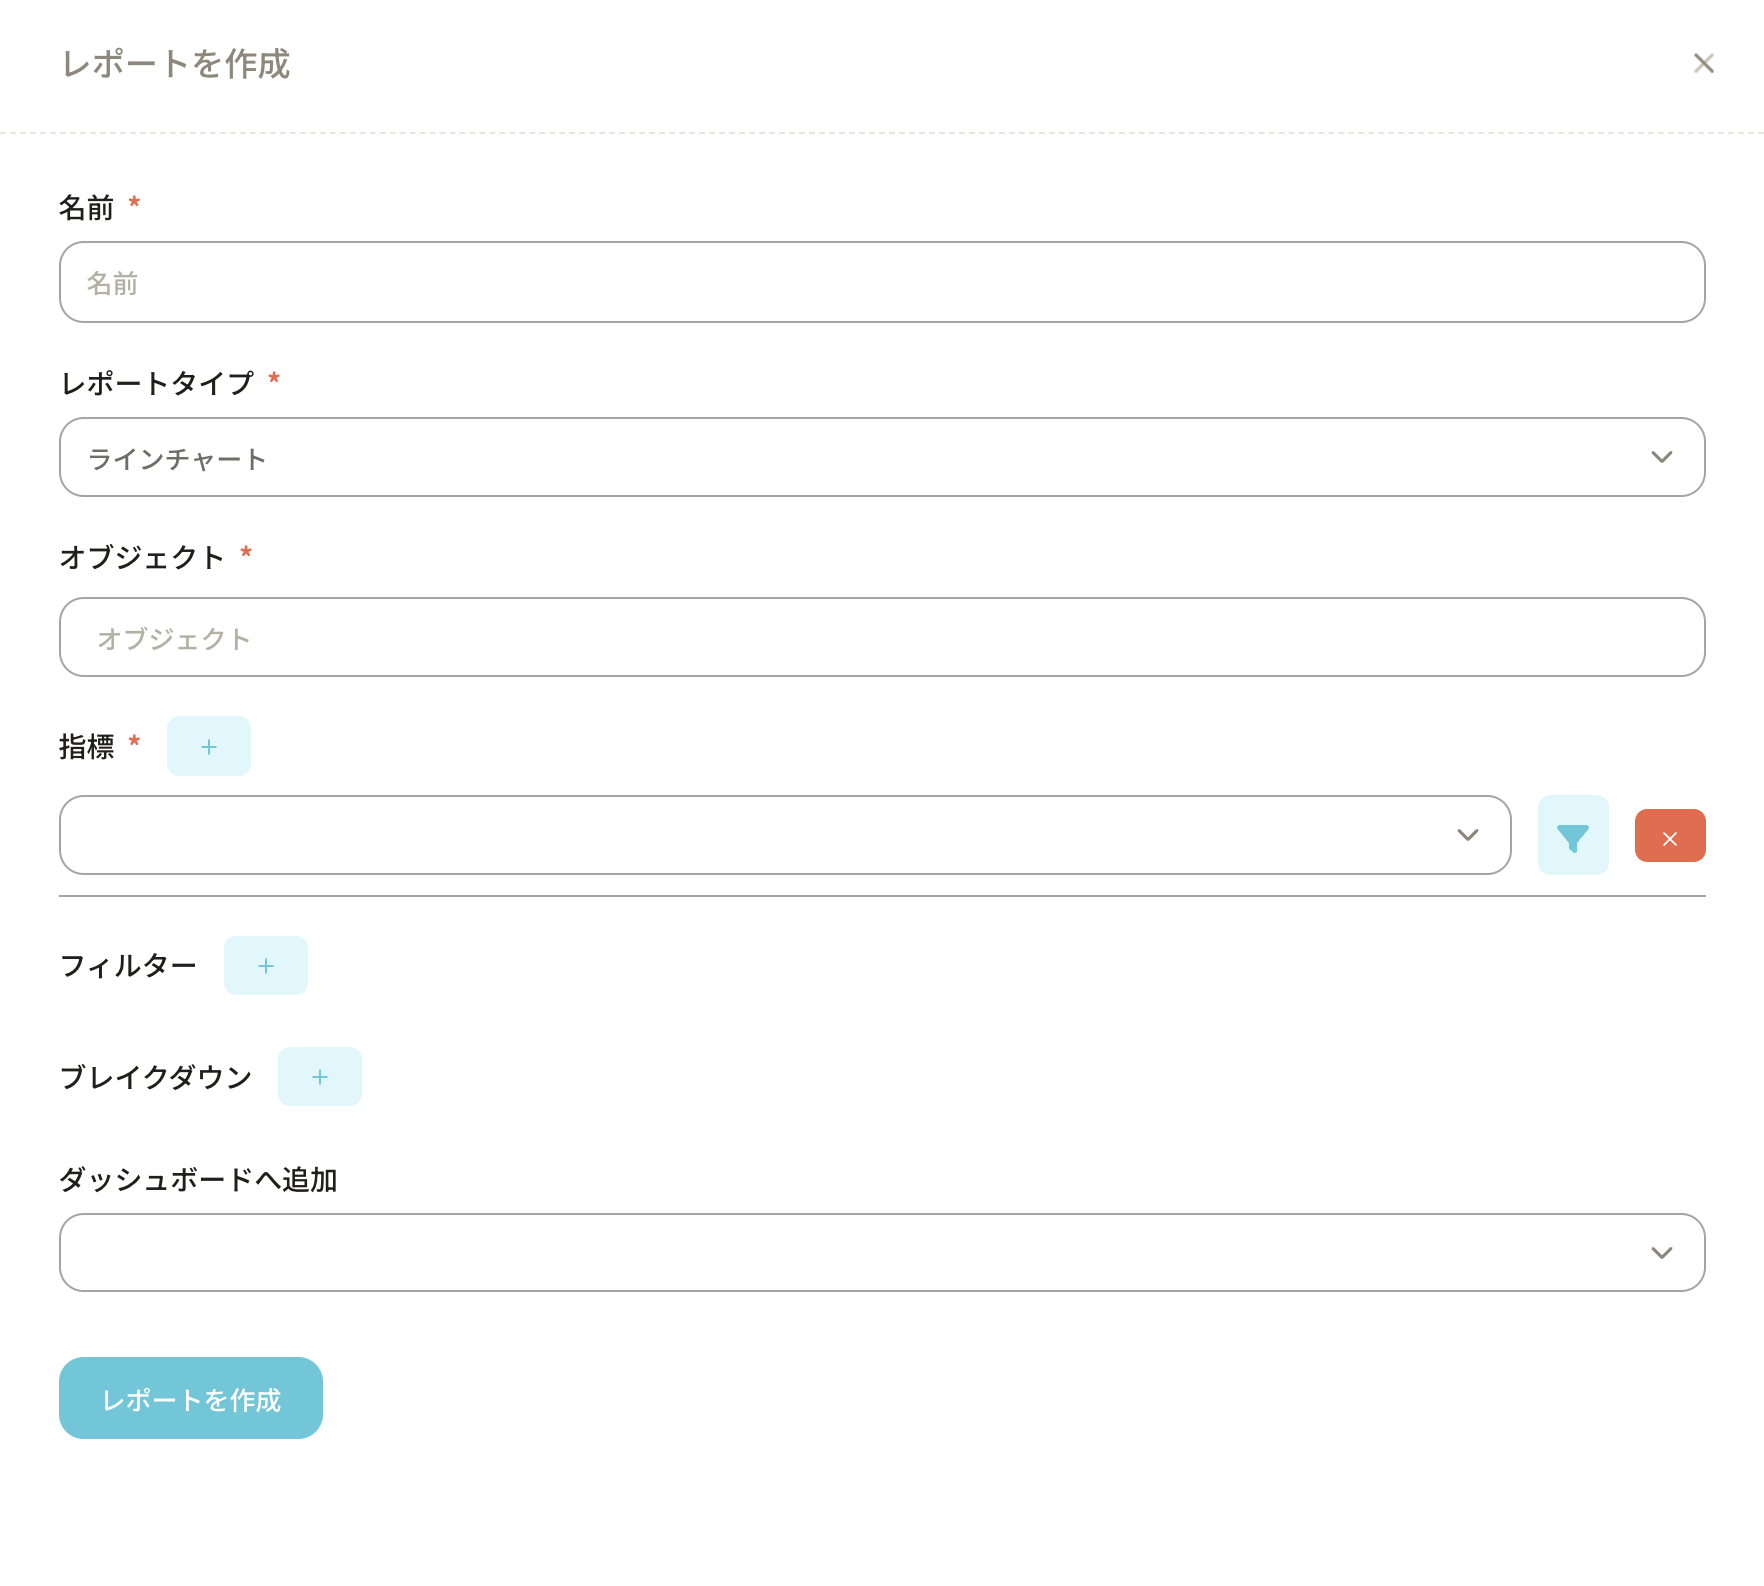
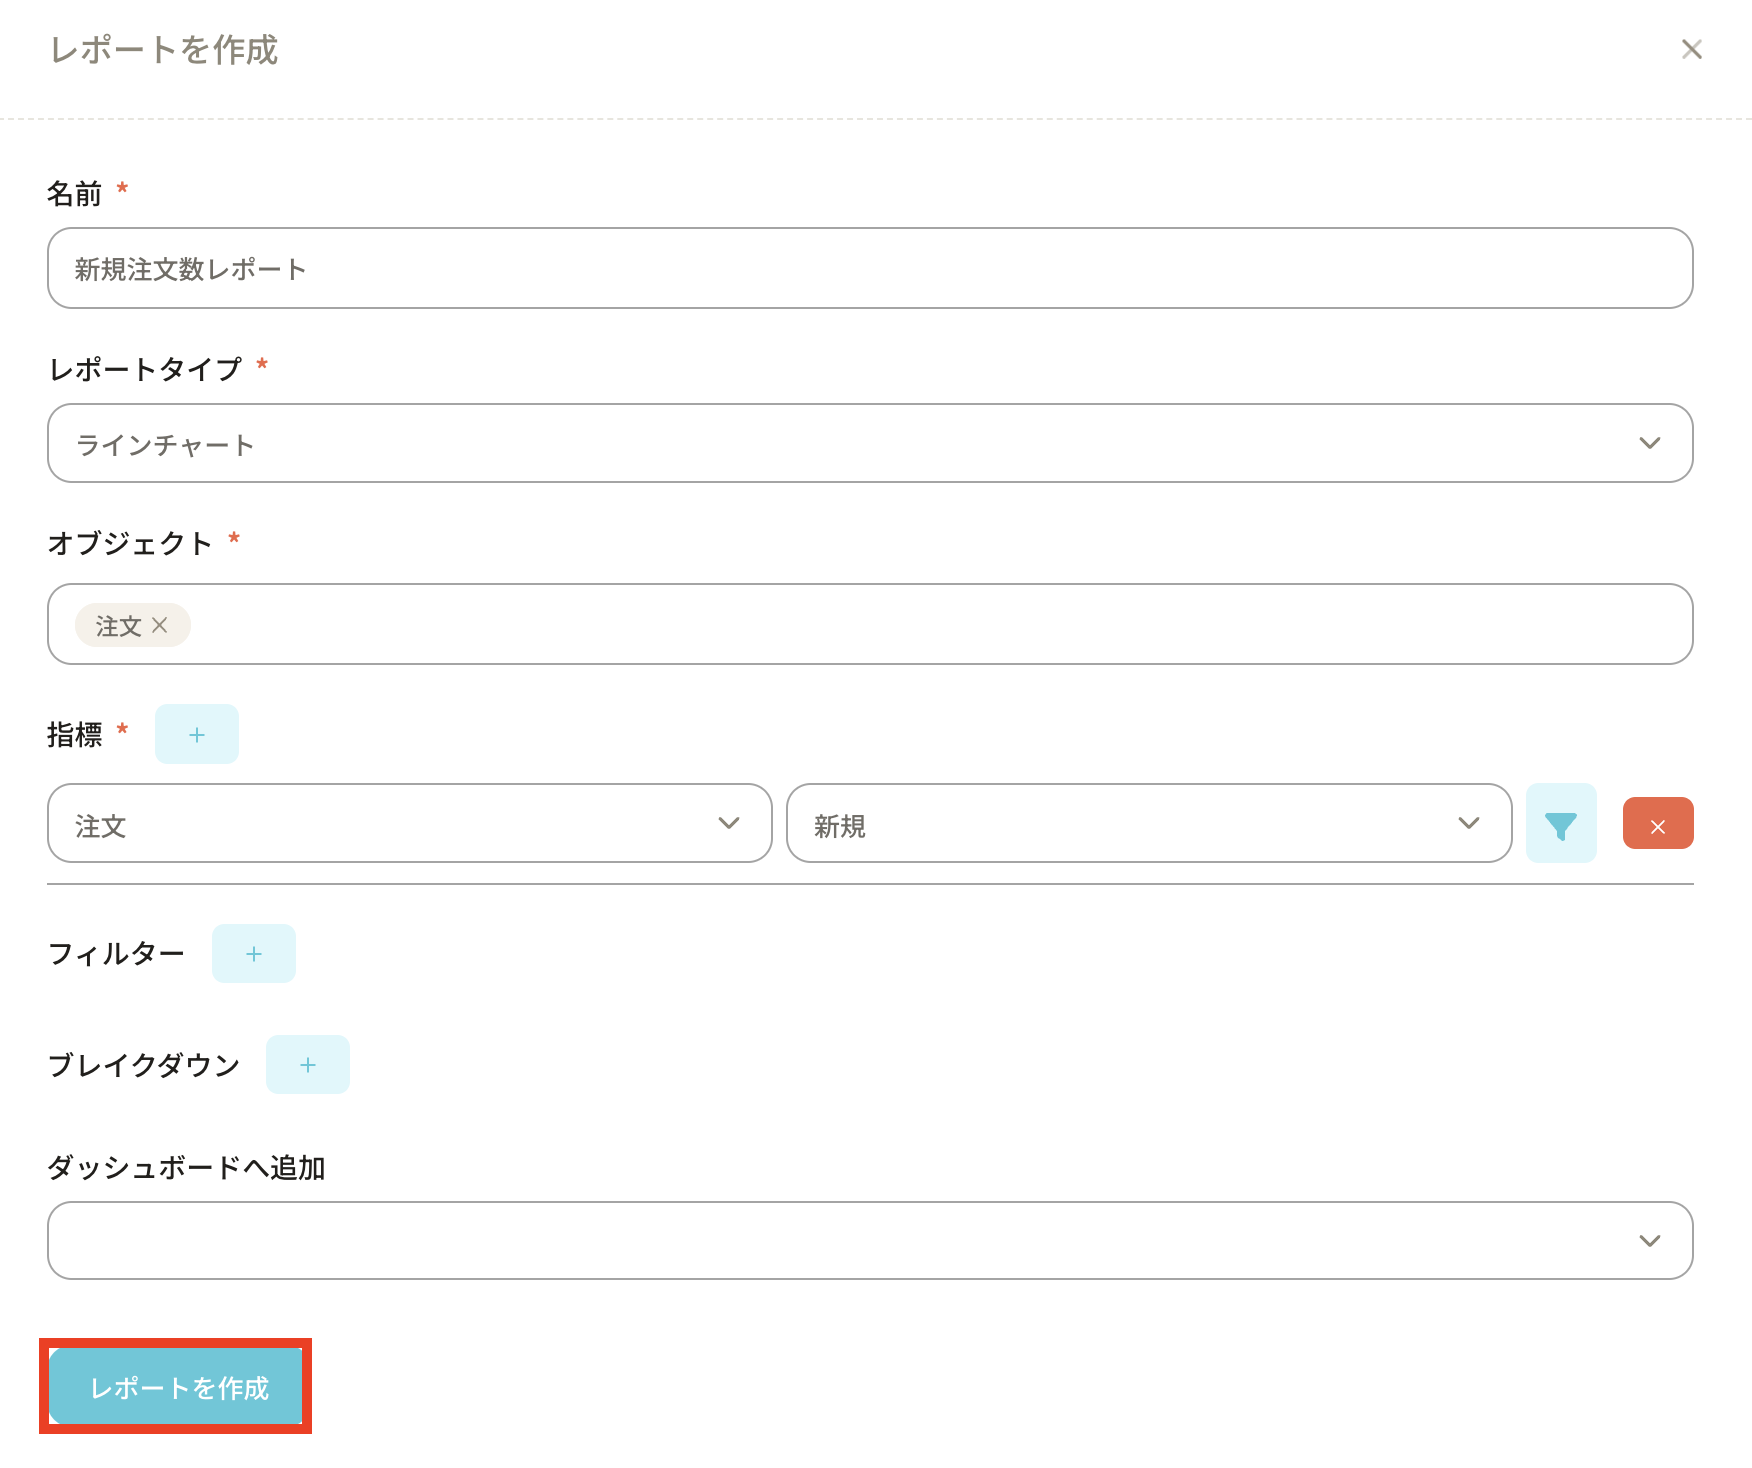
In Create Report, enter the report settings.
Give the report a clear name.
Select the report type, such as line chart, bar chart, table, pivot table, number, or forecast.
Select the object to analyze.
Select the metric. For example, an order report can count new orders or summarize order sales.
Add filters to include only the records that should be analyzed.
Add a breakdown if users need to compare results by status, owner, category, or another field.
Click Create Report.
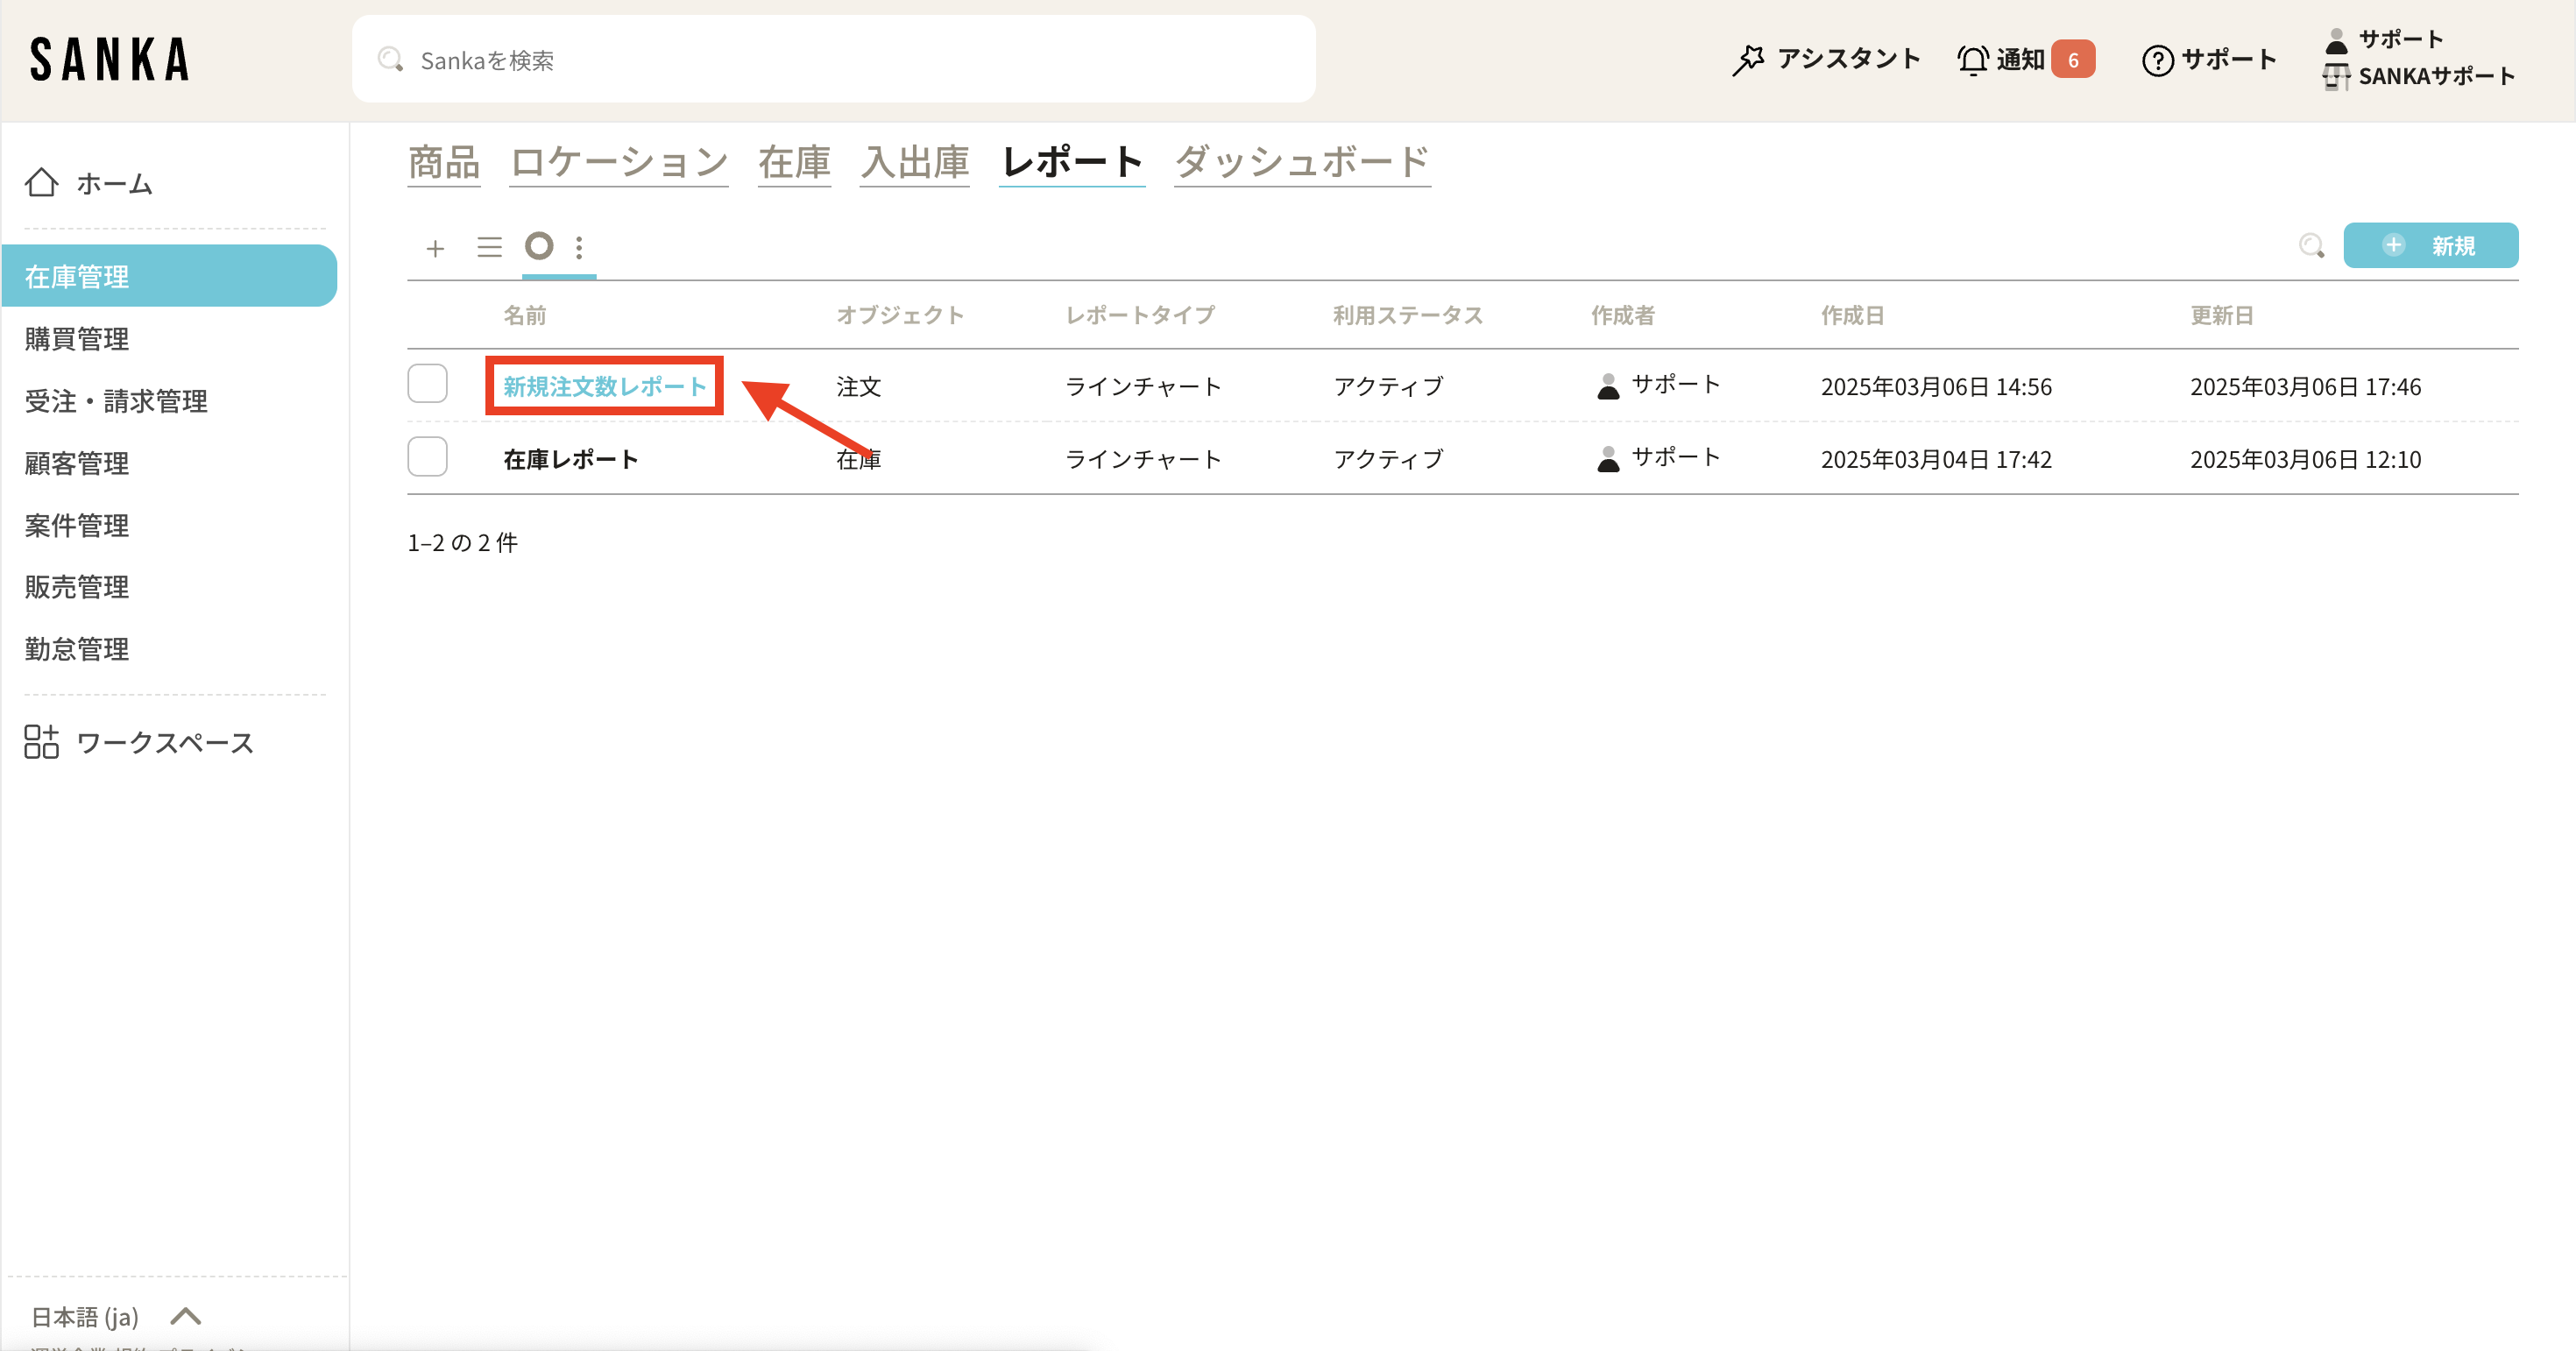
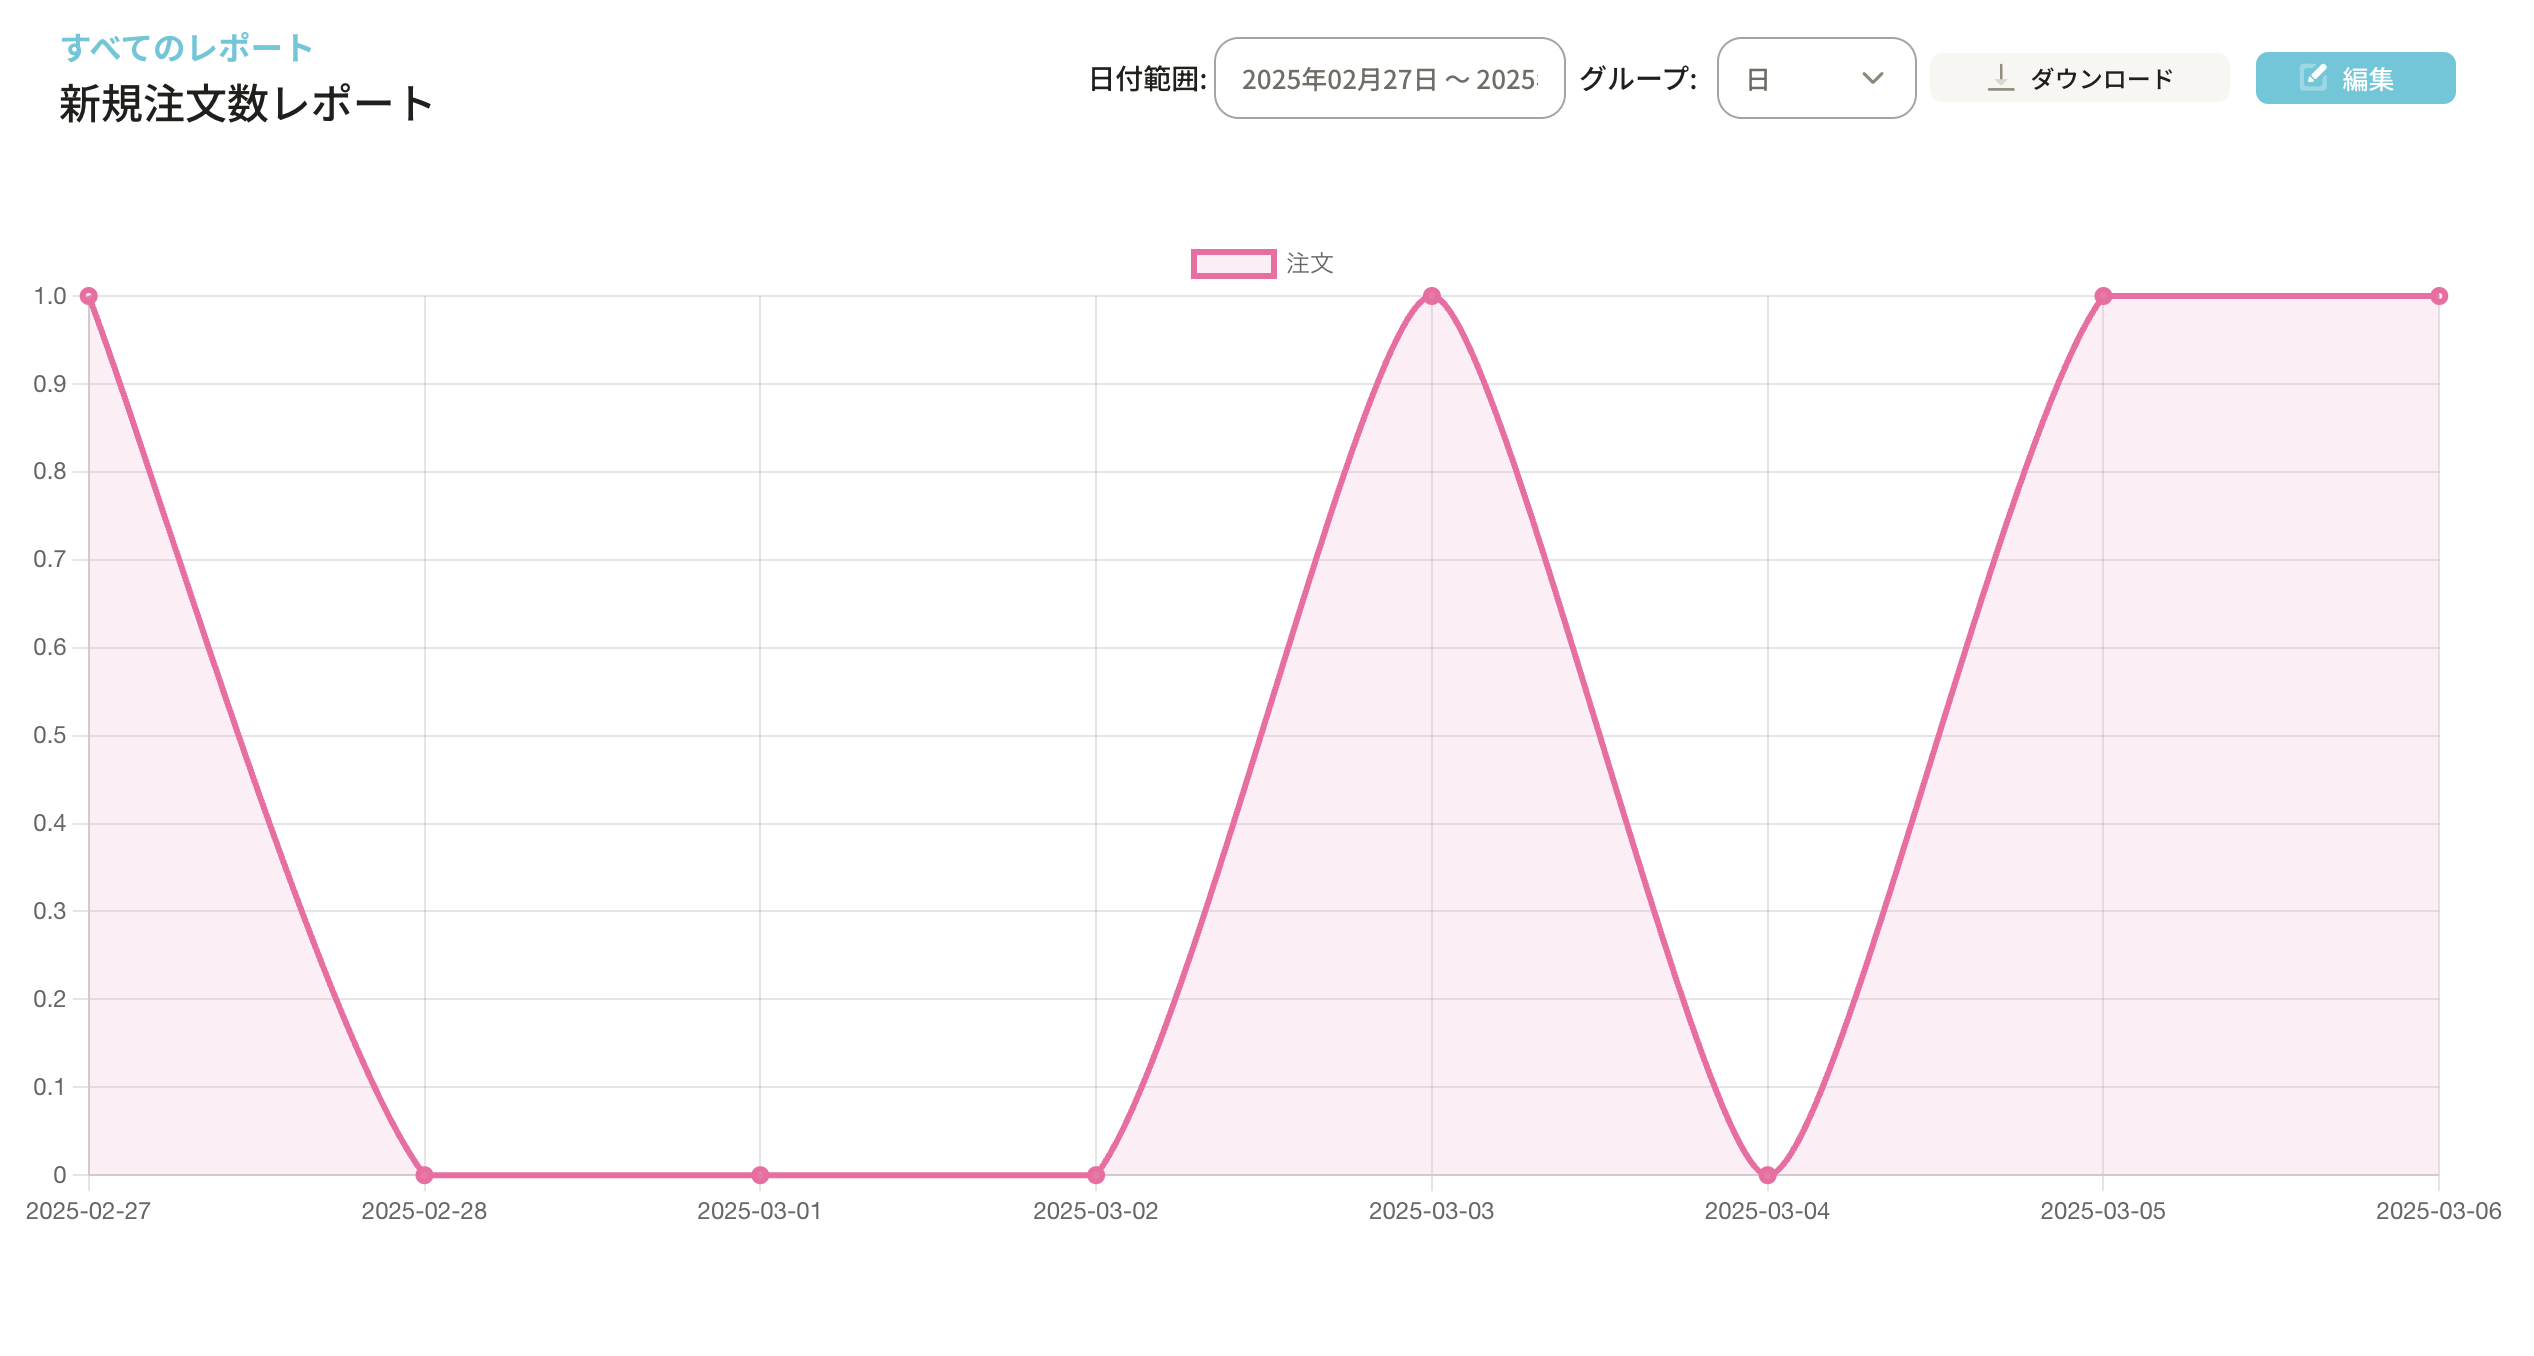
The new report appears in the report list.Click the report name to open the chart.
Create an MRR bar graph
You can visualize MRR, or recurring revenue, with a monthly bar graph and use stacked breakdowns to review the total by owner or category.
Before you start
You have permission to create reports.
The billing records that feed recurring revenue are registered.
One-time invoices can be separated from recurring invoices through a field, status, item category, or another filter.
Set the bar graph and target data
Open Reports in the left menu.
Click New to open the report drawer.
Enter the report name, such as MRR by owner.
Select Bar Chart for Report Type.
Select the billing or invoice object that stores recurring revenue.
Select the amount metric.
Set MRR aggregation and stacking
For the date or X-axis field, select the invoice issue date, billing period, or another date your team uses for recurring revenue.
Group the date field by month.
Add a filter that excludes one-time invoices if they should not be part of MRR.
Select a breakdown axis, such as record owner, department, product category, or plan.
Turn on stacked display if you want each breakdown to appear as part of the bar total.
Save the report.
If MRR does not match finance expectations, compare the report filters against the billing records, invoice statuses, billing periods, refunds, credits, and currency settings before changing the report.
Update, archive, or delete reports
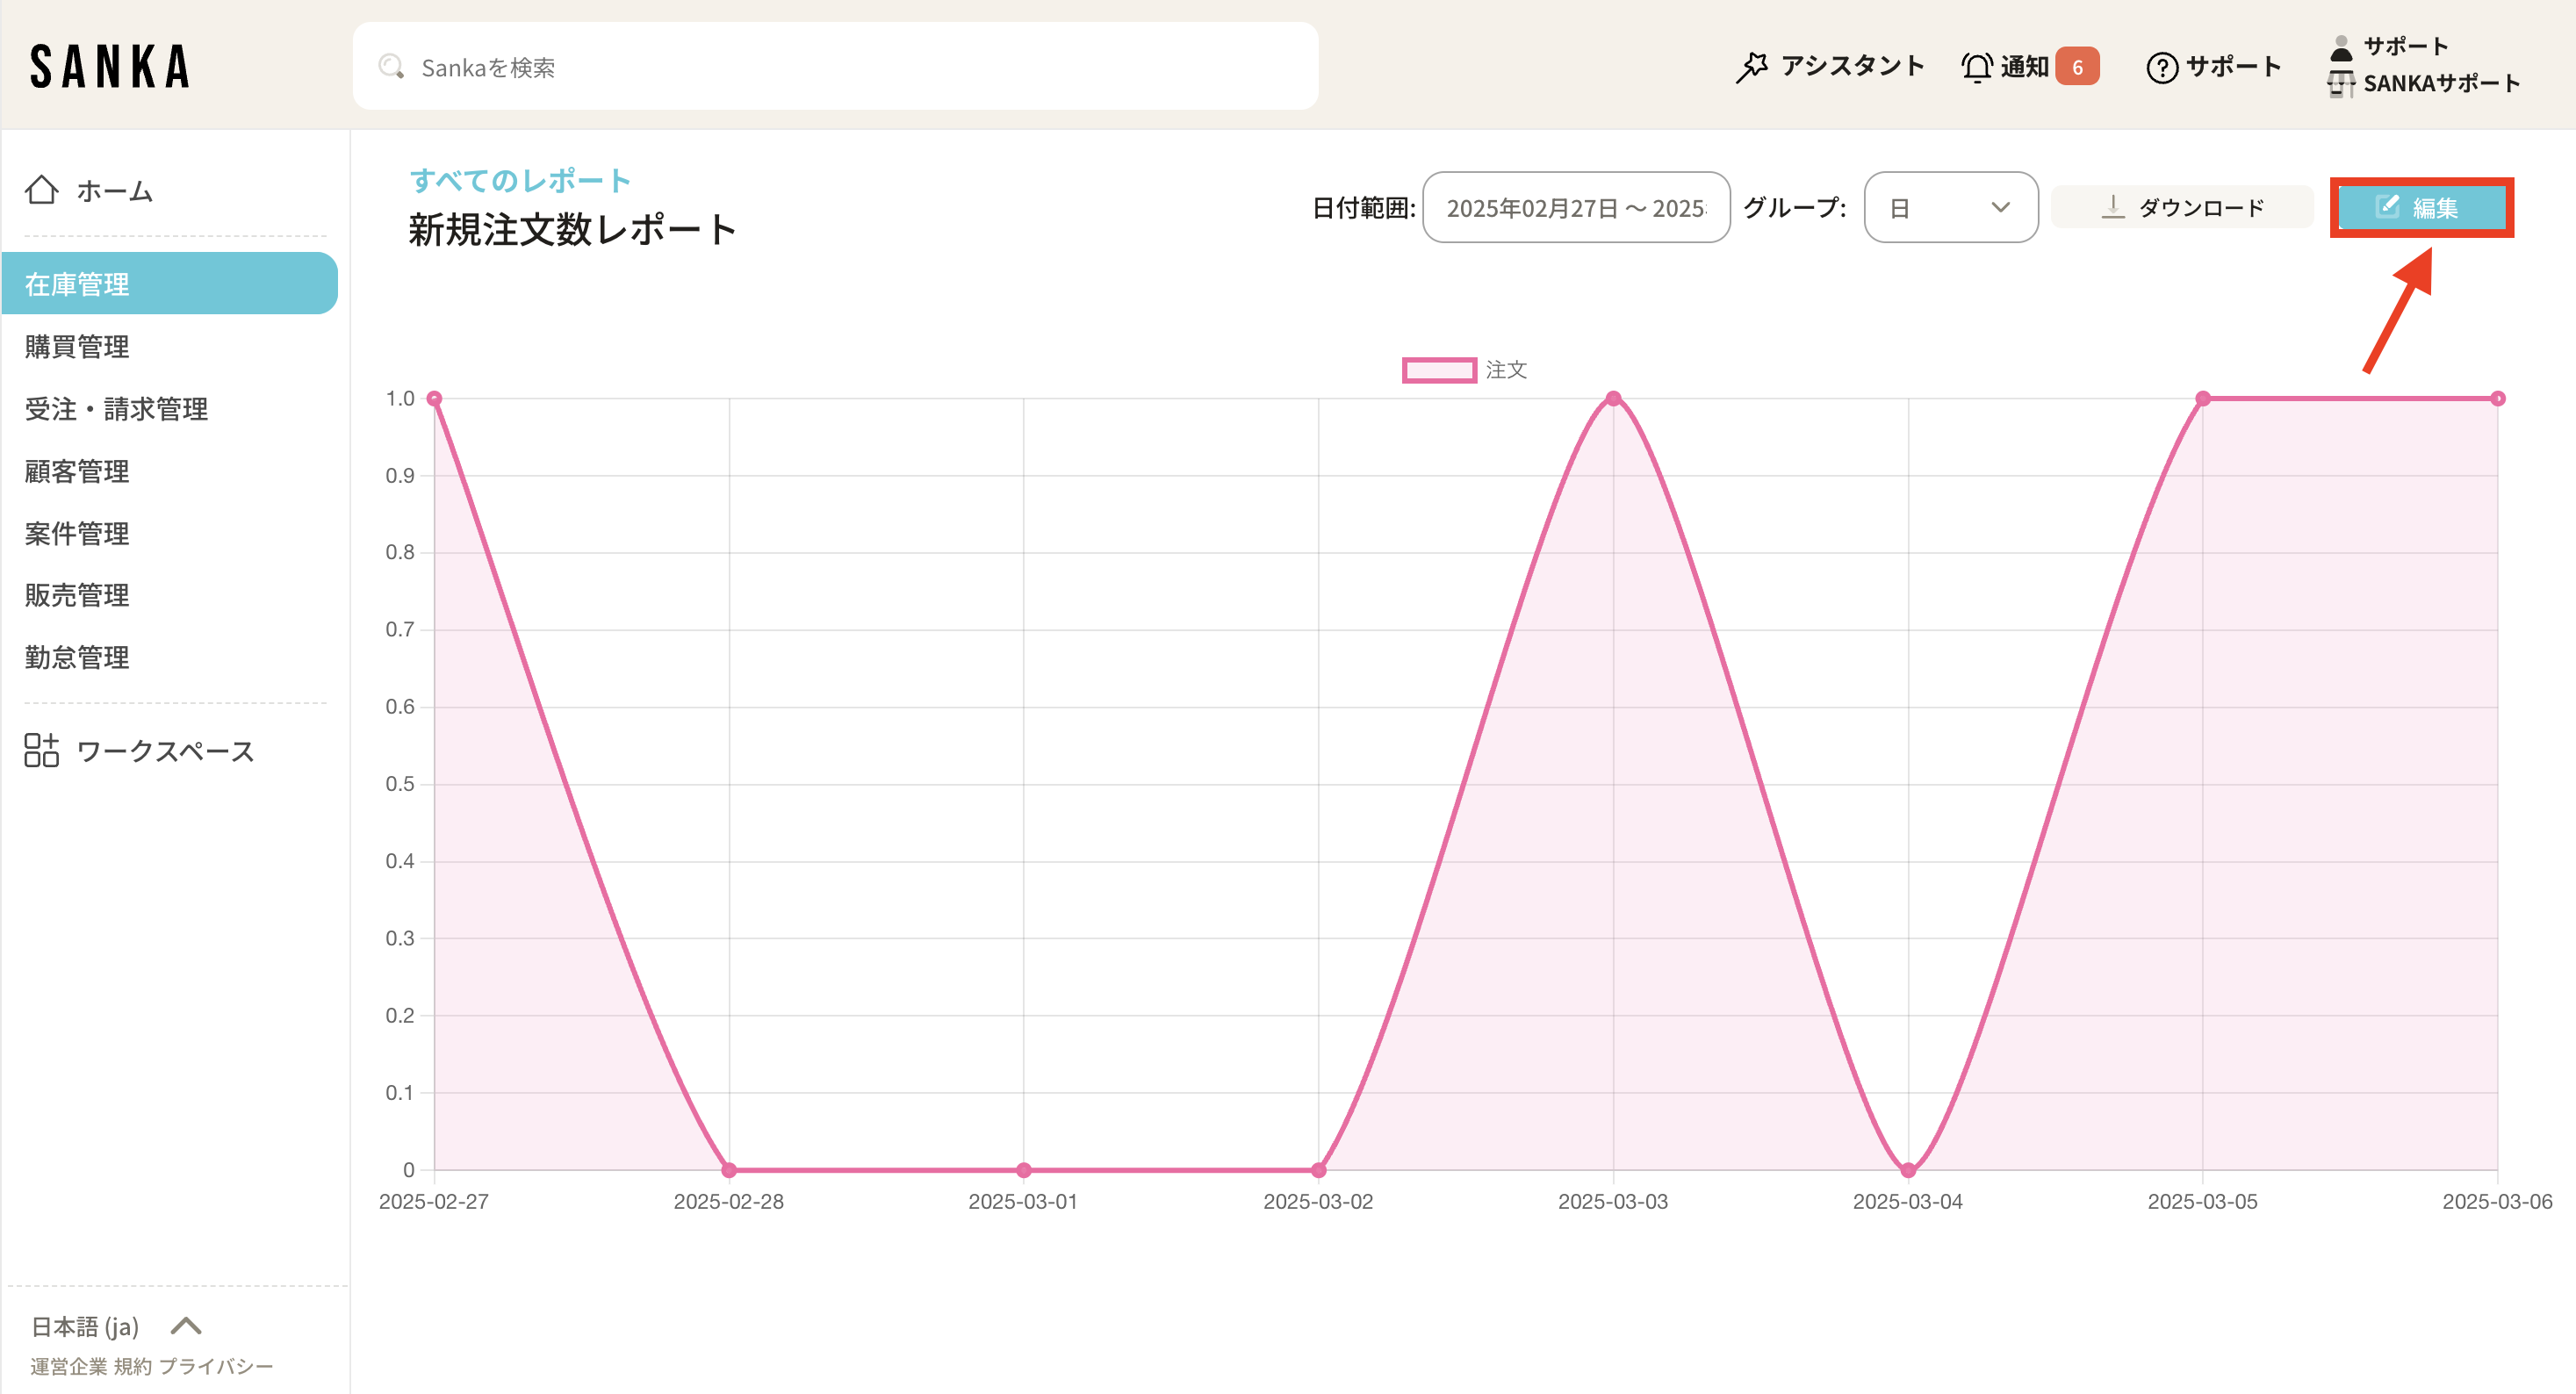
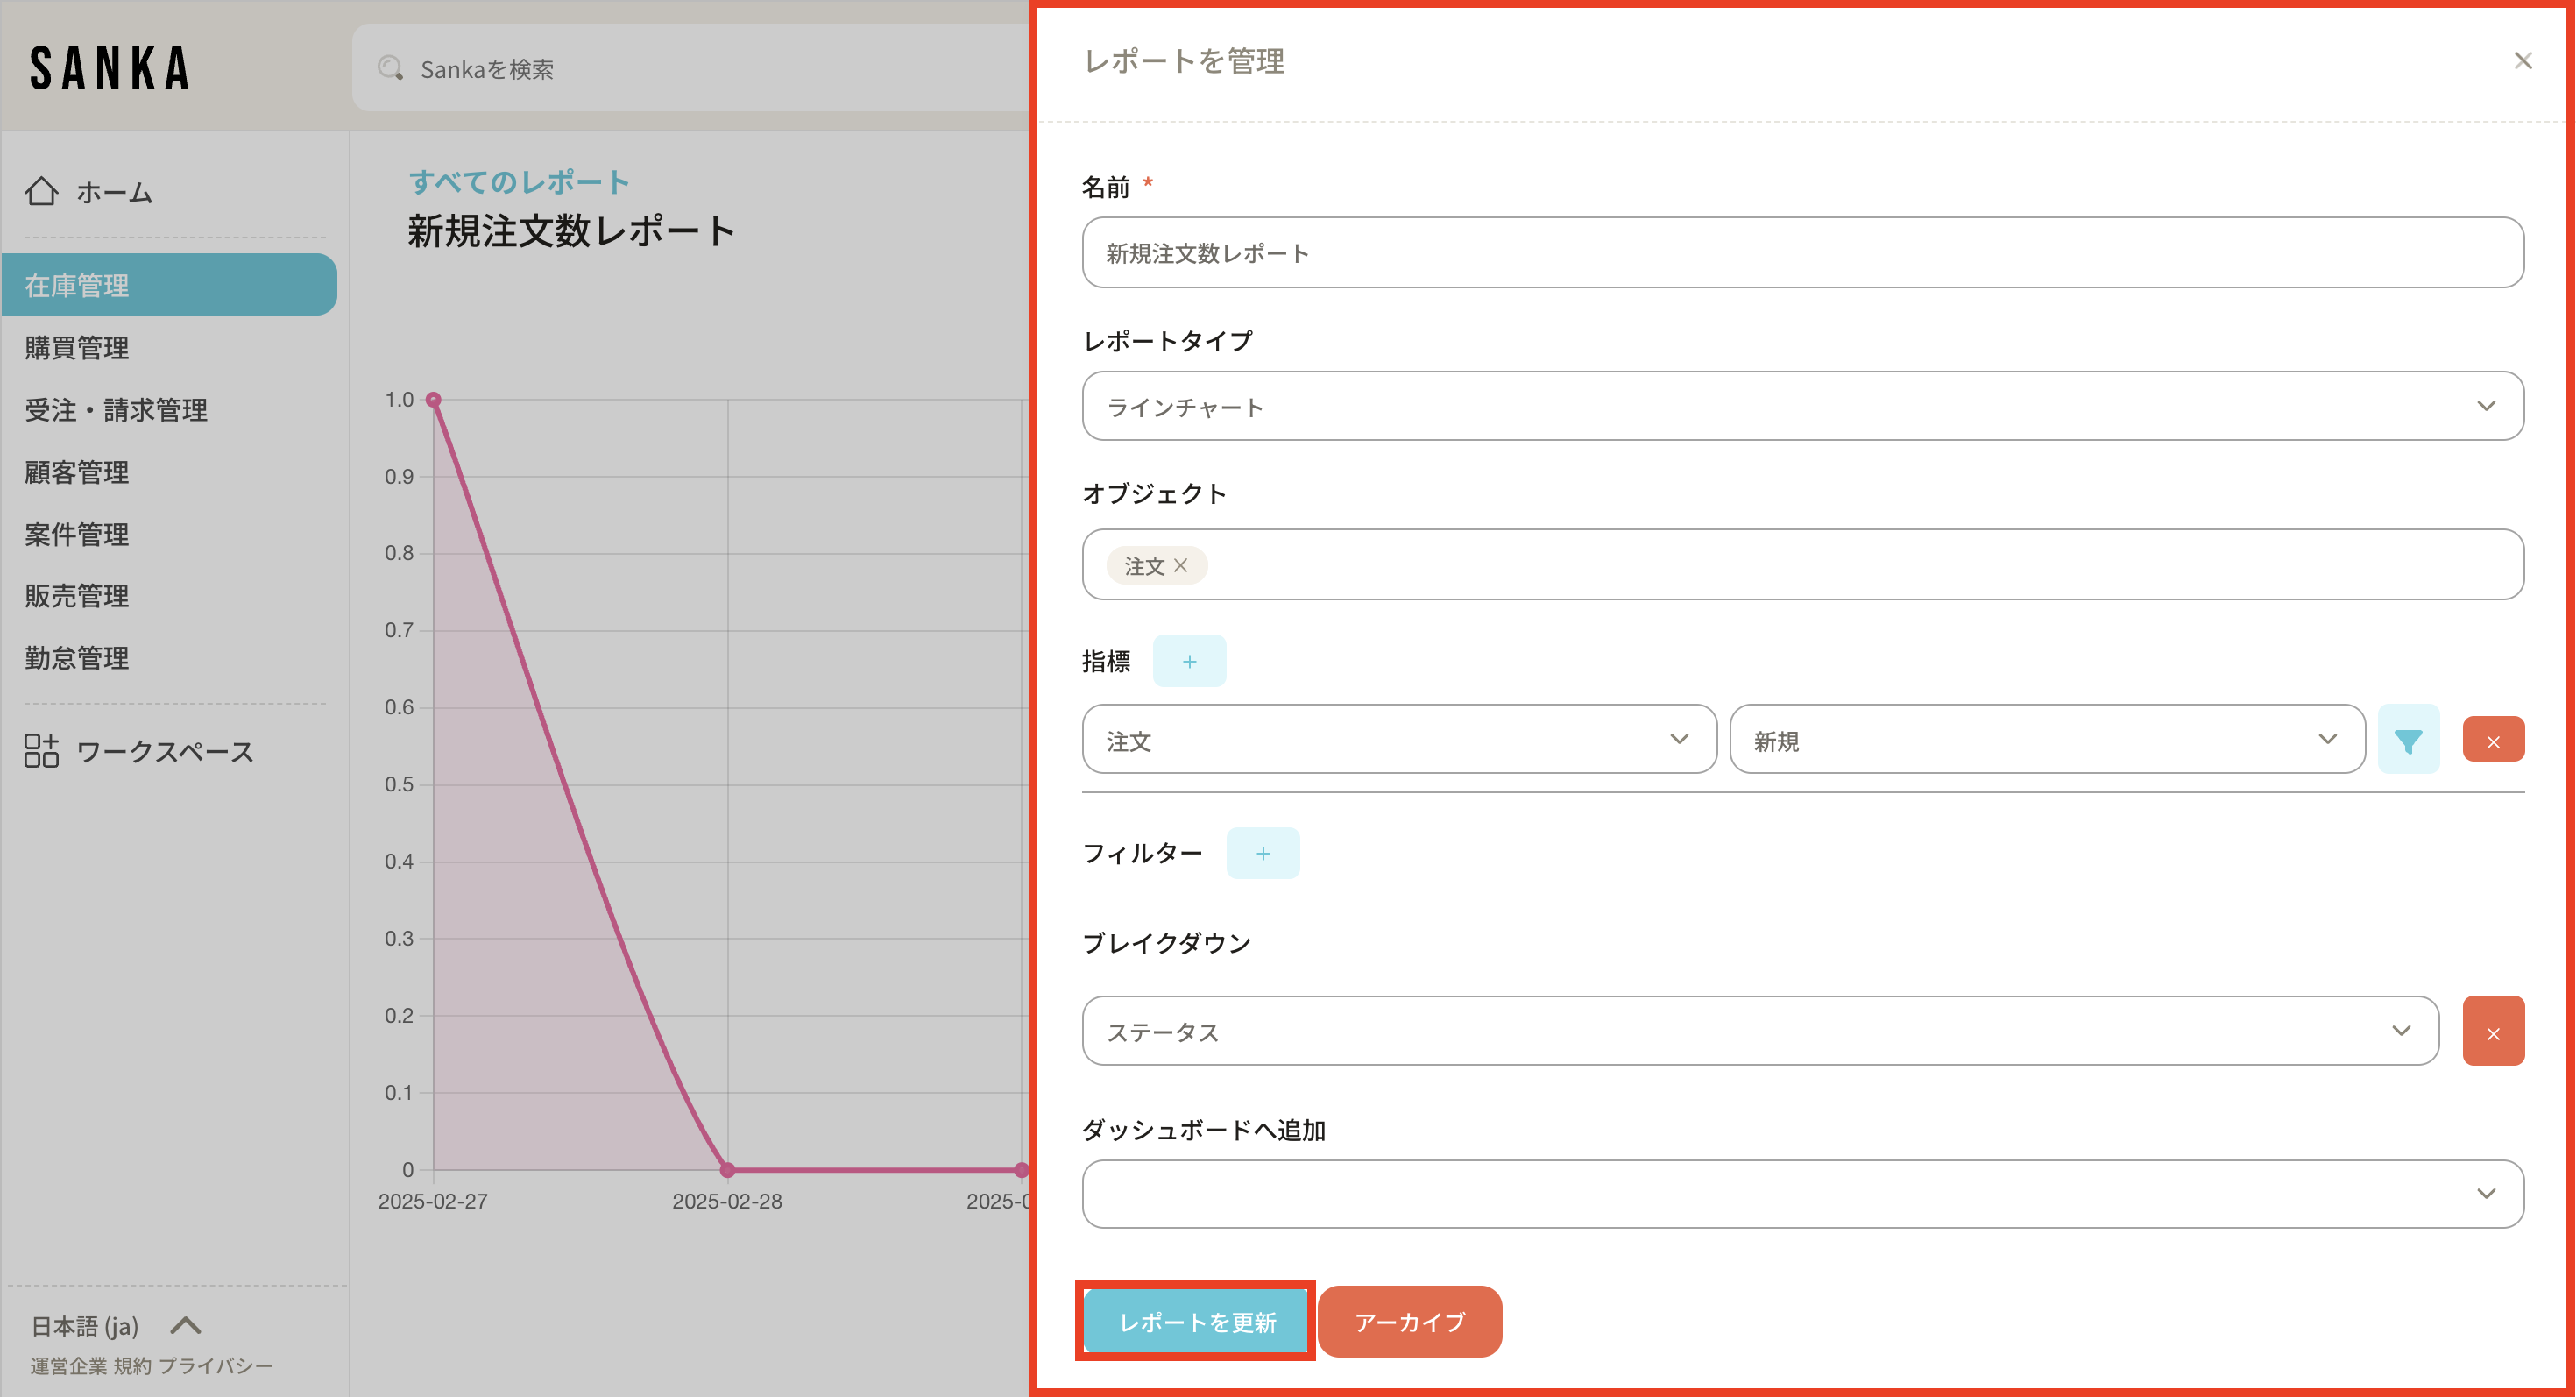
To update a report, open the report list and select the report.Open the report record.Click Edit.Update the settings in Manage Report, then click Update Report. Use Archive when you want to hide the report from the active report list without deleting it.To delete a report, select the checkbox from the report list and choose Delete.Confirm only after checking that no dashboard or team workflow depends on the report. Deleted reports cannot be restored from the normal report screen.
Troubleshooting
The report shows no data
Check whether source records exist, whether they are archived, whether the selected date period includes them, and whether filters exclude them. If the report is on a dashboard, open the report itself to confirm whether the issue is the report or the dashboard placement.
The report number does not match an object list or export
Compare the selected object, metric, filters, date field, time period, status, owner, currency, and archived-record handling. Object lists and exports may use a different saved view, so they may not match a report until the same filters are applied.
A breakdown or chart type is missing
Confirm that the selected field can be used for the chart type. Some fields are better suited for grouping, while others are only useful as filters or values. Also check whether the property exists on the selected object.
A user cannot create or edit reports
Check the user's role, module access, object access, and whether the workspace allows the user to manage reports. If they can view a report but not the underlying records, the chart may look incomplete.
A report changed after an import or integration sync
Reports recalculate from source records. Review recent imports, integration updates, actions, workflows, and manual edits before treating the report as broken.
Checkpoints
Before sending a customer-facing answer about a report, confirm the report settings, source records, permissions, and recent changes.
Search Sanka...
Review report changes
Logs
Search logsAll actionsAll dates
ID / ActionDateTarget / ItemChangeActor
3Reviewed report settings2026/05/10 09:30MRR by ownerChecked metric, filters, date field, and dashboard usageClaude / Codex
2Updated report filter2026/05/10 09:45MRR by ownerExcluded one-time invoices from recurring revenueSanka user
1Imported billing records2026/05/10 10:15Invoice recordsAdded May billing data used by the reportSanka user
Use report history together with the object list or export when a customer asks why a number changed.
 The new report appears in the report list.
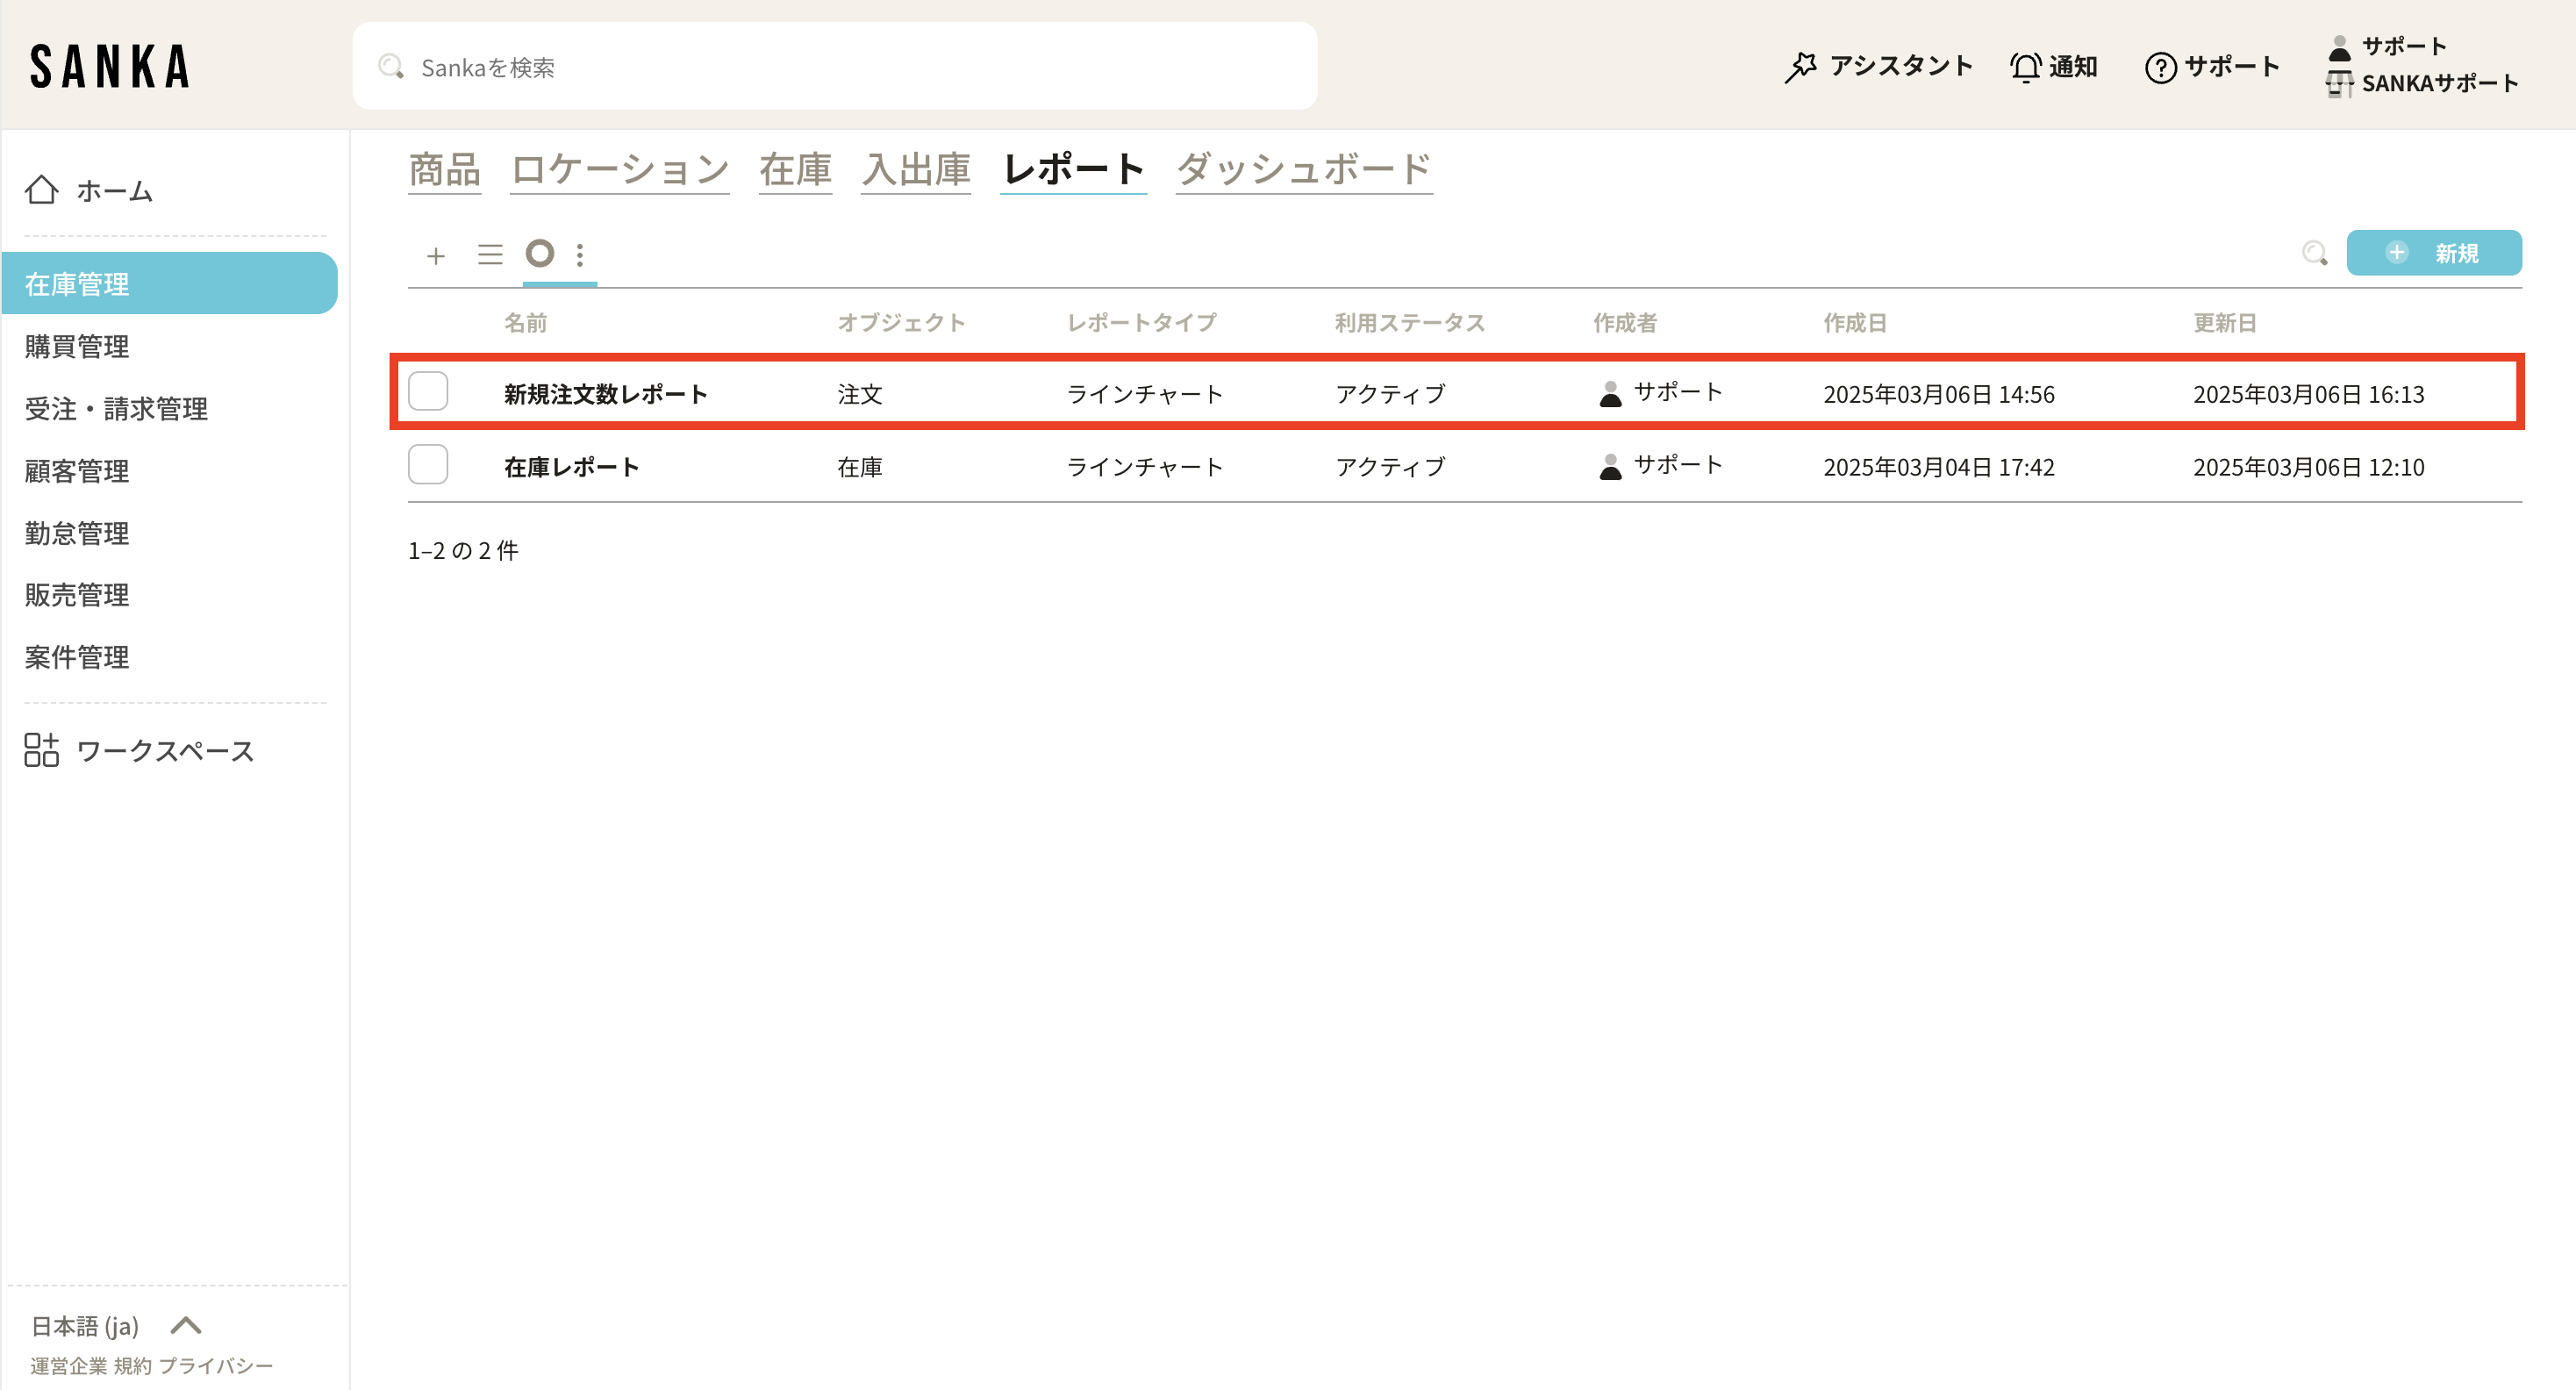 Click the report name to open the chart.
 Open the report record.
 Click Edit.
 Update the settings in Manage Report, then click Update Report. Use Archive when you want to hide the report from the active report list without deleting it.
 To delete a report, select the checkbox from the report list and choose Delete.
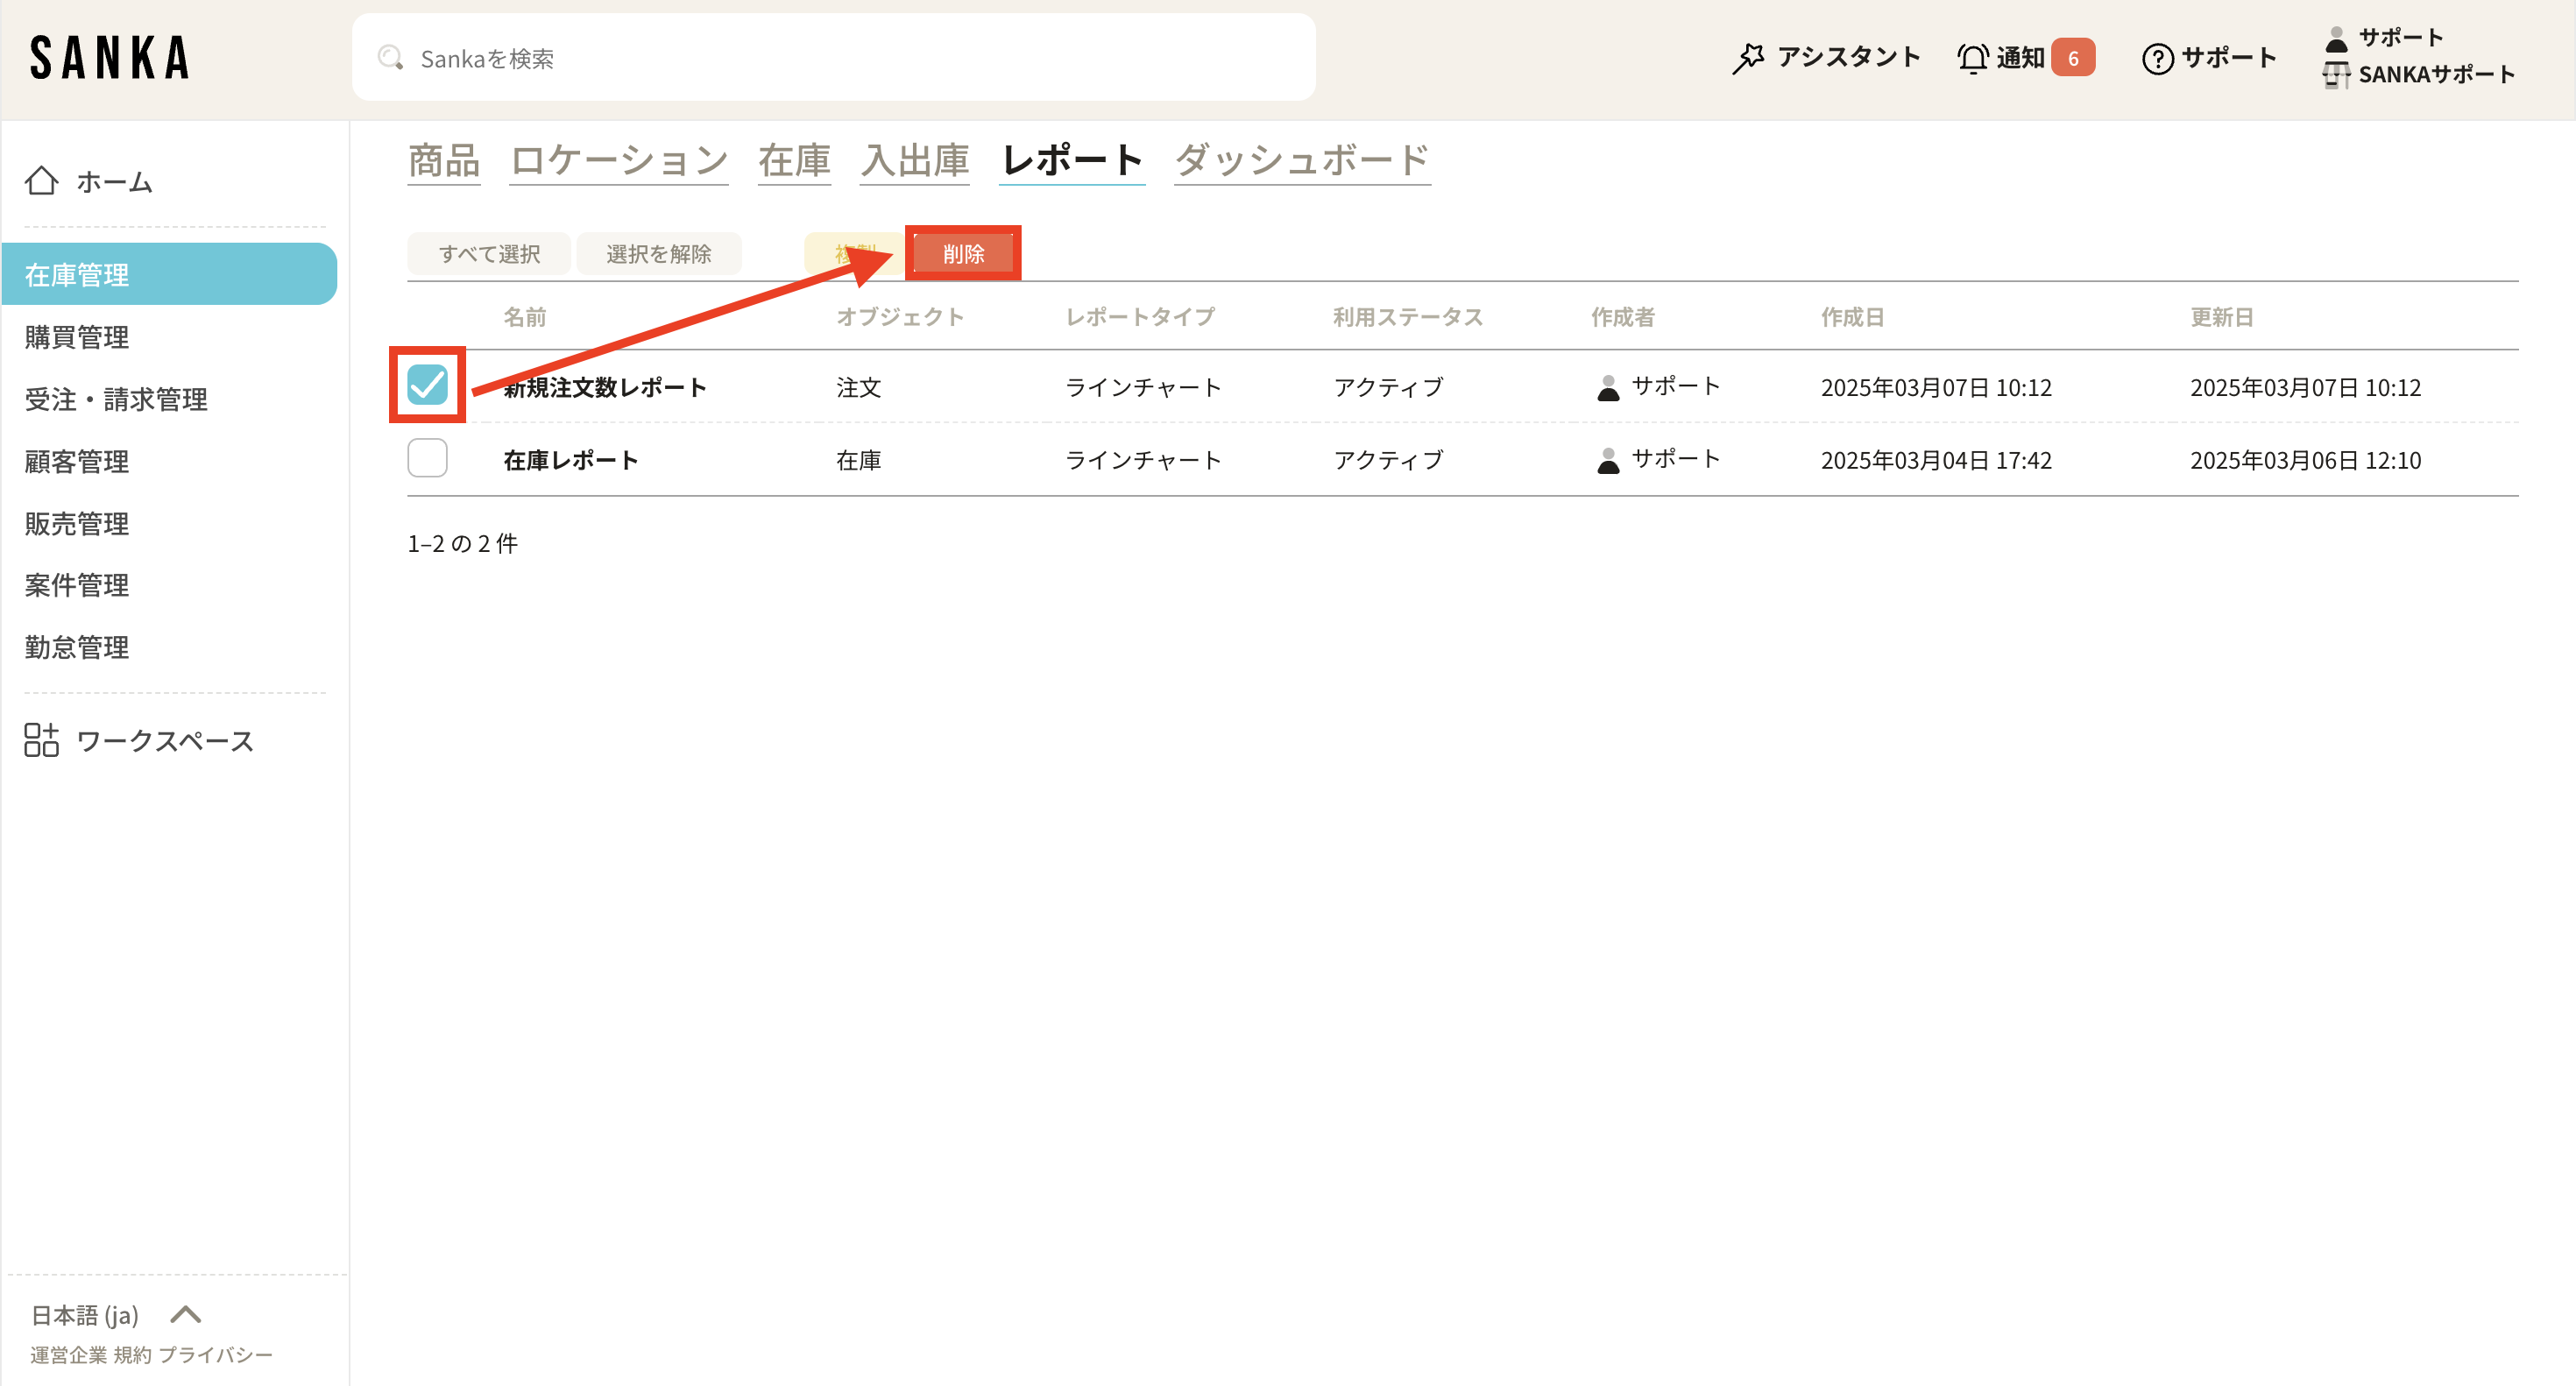 Confirm only after checking that no dashboard or team workflow depends on the report. Deleted reports cannot be restored from the normal report screen.